
| Name: NCAM1 | Sequence: fasta or formatted (761aa) | NCBI GI: 115529478 | |
|
Description: neural cell adhesion molecule 1 isoform 3
|
Referenced in:
| ||
Other entries for this name:
alt prot [858aa] neural cell adhesion molecule 1 isoform 2 alt prot [848aa] neural cell adhesion molecule 1 isoform 1 | |||
|
Composition:
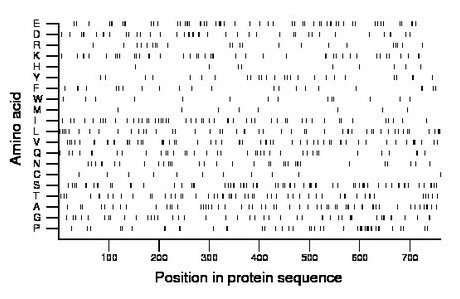
Amino acid Percentage Count Longest homopolymer A alanine 7.5 57 2 C cysteine 1.4 11 1 D aspartate 5.5 42 2 E glutamate 7.6 58 2 F phenylalanine 3.0 23 2 G glycine 5.9 45 2 H histidine 1.2 9 1 I isoleucine 6.7 51 2 K lysine 5.8 44 2 L leucine 6.8 52 4 M methionine 1.2 9 1 N asparagine 4.5 34 2 P proline 5.9 45 4 Q glutamine 4.9 37 2 R arginine 2.9 22 1 S serine 9.2 70 3 T threonine 7.1 54 2 V valine 7.6 58 2 W tryptophan 1.8 14 1 Y tyrosine 3.4 26 1 |
Comparative genomics:
Search single species RefSeq proteins at NCBI
Search summary 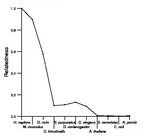
Figure data | ||
Related human proteins:Protein Relative score Description Self-match 1.000 neural cell adhesion molecule 1 isoform 3 NCAM1 0.908 neural cell adhesion molecule 1 isoform 1 NCAM1 0.903 neural cell adhesion molecule 1 isoform 2 NCAM2 0.360 neural cell adhesion molecule 2 precursor HMCN1 0.094 hemicentin 1 ROBO2 0.091 roundabout, axon guidance receptor, homolog 2 isofo... ROBO2 0.091 roundabout, axon guidance receptor, homolog 2 isofor... HMCN2 0.086 PREDICTED: hemicentin 2 HMCN2 0.086 PREDICTED: hemicentin 2 HMCN2 0.086 PREDICTED: hemicentin 2 ROBO1 0.086 roundabout 1 isoform b ROBO1 0.086 roundabout 1 isoform a ROBO1 0.083 roundabout 1 isoform d ROBO1 0.083 roundabout 1 isoform c LOC642132 0.083 PREDICTED: similar to roundabout 1 isoform 1 LOC642132 0.083 PREDICTED: similar to roundabout 1 isoform 2 TTN 0.080 titin isoform N2-A ROBO3 0.079 roundabout, axon guidance receptor, homolog 3 DCC 0.078 deleted in colorectal carcinoma CDON 0.076 surface glycoprotein, Ig superfamily member PXDN 0.076 peroxidasin DSCAM 0.075 Down syndrome cell adhesion molecule isoform CHD2-42... LOC100292387 0.073 PREDICTED: similar to hemicentin 2 SDK2 0.071 sidekick 2 NEO1 0.071 neogenin homolog 1 NRCAM 0.069 neuronal cell adhesion molecule isoform B precursor ... BOC 0.068 brother of CDO MXRA5 0.068 adlican DSCAML1 0.067 Down syndrome cell adhesion molecule like 1 SDK1 0.066 sidekick 1Human BLASTP results (used to prepare the table) | |||
Gene descriptions are from NCBI RefSeq. Search results were obtained with NCBI BLAST and RefSeq entries. When identical proteins are present, the self-match may not be listed first in BLASTP output. In such cases, the table above has been reordered to place it first.
See About the Figures for the scoring system used in the figure above right. The same scoring system was used in the table of BLASTP results.
Guide to the Human Genome
Copyright © 2010 by Stewart Scherer. All rights reserved.
