
| Name: TPM3 | Sequence: fasta or formatted (247aa) | NCBI GI: 114155148 | |
|
Description: tropomyosin 3 isoform 5
|
Referenced in:
| ||
Other entries for this name:
alt prot [285aa] tropomyosin 3 isoform 1 alt prot [248aa] tropomyosin 3 isoform 4 alt prot [247aa] tropomyosin 3 isoform 3 alt prot [248aa] tropomyosin 3 isoform 2 | |||
|
Composition:
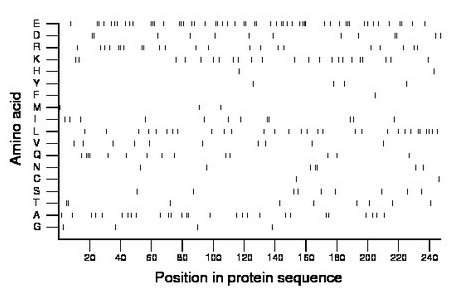
Amino acid Percentage Count Longest homopolymer A alanine 11.3 28 2 C cysteine 0.8 2 1 D aspartate 5.3 13 2 E glutamate 21.9 54 3 F phenylalanine 0.4 1 1 G glycine 1.6 4 1 H histidine 0.8 2 1 I isoleucine 4.9 12 2 K lysine 9.3 23 1 L leucine 12.1 30 2 M methionine 1.2 3 1 N asparagine 2.8 7 2 P proline 0.0 0 0 Q glutamine 5.7 14 3 R arginine 8.9 22 2 S serine 3.6 9 1 T threonine 3.6 9 2 V valine 4.0 10 1 W tryptophan 0.0 0 0 Y tyrosine 1.6 4 1 |
Comparative genomics:
Search single species RefSeq proteins at NCBI
Search summary 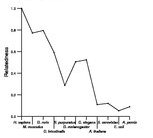
Figure data | ||
Related human proteins:Protein Relative score Description Self-match 1.000 tropomyosin 3 isoform 5 TPM3 0.941 tropomyosin 3 isoform 3 TPM3 0.900 tropomyosin 3 isoform 4 TPM3 0.841 tropomyosin 3 isoform 2 TPM1 0.822 tropomyosin 1 alpha chain isoform 6 TPM4 0.802 tropomyosin 4 isoform 2 TPM3 0.756 tropomyosin 3 isoform 1 TPM2 0.699 tropomyosin 2 (beta) isoform 1 TPM1 0.697 tropomyosin 1 alpha chain isoform 1 TPM4 0.683 tropomyosin 4 isoform 1 TPM1 0.681 tropomyosin 1 alpha chain isoform 3 TPM1 0.679 tropomyosin 1 alpha chain isoform 2 TPM2 0.642 tropomyosin 2 (beta) isoform 2 TPM1 0.633 tropomyosin 1 alpha chain isoform 5 TPM1 0.617 tropomyosin 1 alpha chain isoform 4 TPM1 0.615 tropomyosin 1 alpha chain isoform 7 TPM2 0.533 tropomyosin 2 (beta) isoform 3 LOC645202 0.123 PREDICTED: hypothetical protein LOC645202 LOC400352 0.114 PREDICTED: similar to Putative golgin subfamily A m... LOC100132816 0.114 PREDICTED: similar to Putative golgin subfamily A m... PLEC1 0.112 plectin 1 isoform 11 PLEC1 0.112 plectin 1 isoform 10 PLEC1 0.112 plectin 1 isoform 8 PLEC1 0.112 plectin 1 isoform 7 PLEC1 0.112 plectin 1 isoform 6 PLEC1 0.112 plectin 1 isoform 3 PLEC1 0.112 plectin 1 isoform 2 PLEC1 0.112 plectin 1 isoform 1 DEF6 0.109 differentially expressed in FDCP 6 homolog LOC440243 0.105 PREDICTED: Putative golgin subfamily A member 6-lik...Human BLASTP results (used to prepare the table) | |||
Gene descriptions are from NCBI RefSeq. Search results were obtained with NCBI BLAST and RefSeq entries. When identical proteins are present, the self-match may not be listed first in BLASTP output. In such cases, the table above has been reordered to place it first.
See About the Figures for the scoring system used in the figure above right. The same scoring system was used in the table of BLASTP results.
Guide to the Human Genome
Copyright © 2010 by Stewart Scherer. All rights reserved.
