
| Name: PLEC1 | Sequence: fasta or formatted (4515aa) | NCBI GI: 41322910 | |
|
Description: plectin 1 isoform 7
|
Referenced in: Ribosomes
| ||
Other entries for this name:
alt prot [4525aa] plectin 1 isoform 3 alt prot [4533aa] plectin 1 isoform 2 alt prot [4551aa] plectin 1 isoform 10 alt prot [4684aa] plectin 1 isoform 6 alt prot [4547aa] plectin 1 isoform 8 alt prot [4547aa] plectin 1 isoform 11 alt prot [4574aa] plectin 1 isoform 1 | |||
|
Composition:
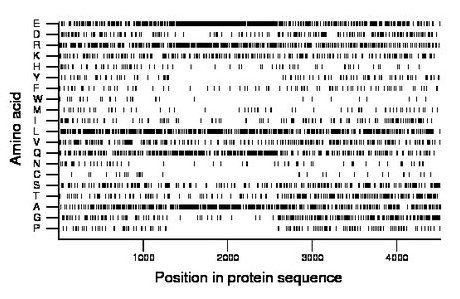
Amino acid Percentage Count Longest homopolymer A alanine 11.2 505 4 C cysteine 0.8 34 3 D aspartate 4.2 190 2 E glutamate 12.8 578 4 F phenylalanine 2.0 89 2 G glycine 5.0 225 3 H histidine 1.6 74 2 I isoleucine 3.3 148 5 K lysine 5.4 243 2 L leucine 12.0 540 4 M methionine 1.3 59 1 N asparagine 1.3 59 1 P proline 2.7 124 3 Q glutamine 8.5 386 4 R arginine 9.5 431 4 S serine 5.6 254 4 T threonine 4.5 203 2 V valine 5.5 248 2 W tryptophan 0.7 30 1 Y tyrosine 2.1 95 2 |
Comparative genomics:
Search single species RefSeq proteins at NCBI
Search summary 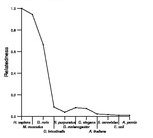
Figure data | ||
Related human proteins:Protein Relative score Description Self-match 1.000 plectin 1 isoform 7 PLEC1 0.999 plectin 1 isoform 1 PLEC1 0.999 plectin 1 isoform 11 PLEC1 0.999 plectin 1 isoform 10 PLEC1 0.999 plectin 1 isoform 8 PLEC1 0.999 plectin 1 isoform 6 PLEC1 0.999 plectin 1 isoform 3 PLEC1 0.999 plectin 1 isoform 2 LOC652460 0.271 PREDICTED: similar to plectin 1, partial MACF1 0.157 microfilament and actin filament cross-linker protei... EPPK1 0.144 epiplakin 1 DSP 0.109 desmoplakin isoform II DSP 0.109 desmoplakin isoform I DST 0.104 dystonin isoform 1e precursor DST 0.097 dystonin isoform 4 DST 0.097 dystonin isoform 3 DST 0.097 dystonin isoform 2 DST 0.097 dystonin isoform 1 DST 0.097 dystonin isoform 1eA precursor DST 0.088 dystonin isoform 1eB precursor SPTBN2 0.047 spectrin, beta, non-erythrocytic 2 PPL 0.045 periplakin SPTBN1 0.044 spectrin, beta, non-erythrocytic 1 isoform 1 SPTBN1 0.043 spectrin, beta, non-erythrocytic 1 isoform 2 SPTB 0.041 spectrin beta isoform a SPTB 0.041 spectrin beta isoform b SPTBN5 0.039 spectrin, beta, non-erythrocytic 5 TCHH 0.038 trichohyalin EVPL 0.038 envoplakin SPTBN4 0.033 spectrin, beta, non-erythrocytic 4 isoform sigma1 [...Human BLASTP results (used to prepare the table) | |||
Gene descriptions are from NCBI RefSeq. Search results were obtained with NCBI BLAST and RefSeq entries. When identical proteins are present, the self-match may not be listed first in BLASTP output. In such cases, the table above has been reordered to place it first.
See About the Figures for the scoring system used in the figure above right. The same scoring system was used in the table of BLASTP results.
Guide to the Human Genome
Copyright © 2010 by Stewart Scherer. All rights reserved.
