
| Name: NHS | Sequence: fasta or formatted (1474aa) | NCBI GI: 209862849 | |
|
Description: Nance-Horan syndrome protein isoform 2
|
Referenced in: Additional Genes in Development
| ||
Other entries for this name:
alt prot [1630aa] Nance-Horan syndrome protein isoform 1 | |||
|
Composition:
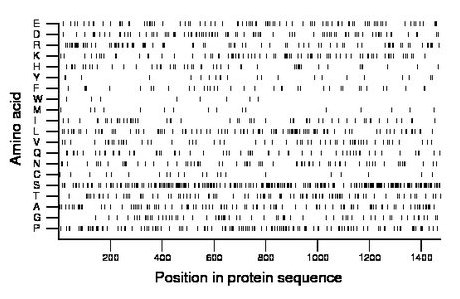
Amino acid Percentage Count Longest homopolymer A alanine 7.0 103 3 C cysteine 1.6 24 2 D aspartate 5.9 87 2 E glutamate 6.4 94 2 F phenylalanine 2.5 37 2 G glycine 4.5 66 2 H histidine 3.4 50 4 I isoleucine 3.9 57 2 K lysine 5.4 80 2 L leucine 6.8 100 4 M methionine 1.2 17 1 N asparagine 4.5 66 2 P proline 8.5 125 3 Q glutamine 4.1 60 2 R arginine 6.2 92 3 S serine 15.8 233 6 T threonine 6.4 94 2 V valine 3.9 58 1 W tryptophan 0.5 8 1 Y tyrosine 1.6 23 2 |
Comparative genomics:
Search single species RefSeq proteins at NCBI
Search summary 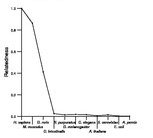
Figure data | ||
Related human proteins:Protein Relative score Description Self-match 1.000 Nance-Horan syndrome protein isoform 2 NHS 0.971 Nance-Horan syndrome protein isoform 1 NHSL1 0.133 NHS-like 1 NHSL2 0.052 NHS-like 2 MUC12 0.015 PREDICTED: mucin 12 MUC12 0.015 PREDICTED: mucin 12, cell surface associated DSPP 0.013 dentin sialophosphoprotein preproprotein MUC16 0.010 mucin 16 SRRM2 0.009 splicing coactivator subunit SRm300 STOX2 0.009 storkhead box 2 NACAD 0.009 NAC alpha domain containing NACAD 0.009 PREDICTED: NAC alpha domain containing LOC100130716 0.008 PREDICTED: similar to mucin 11 MUC6 0.008 mucin 6, gastric SETD1B 0.008 SET domain containing 1B MUC12 0.007 PREDICTED: mucin 12 MUC17 0.007 mucin 17 KIAA1522 0.007 hypothetical protein LOC57648 MUC4 0.006 mucin 4 isoform a EHBP1 0.006 EH domain binding protein 1 isoform 1 NOLC1 0.006 nucleolar and coiled-body phosphoprotein 1 DPCR1 0.006 diffuse panbronchiolitis critical region 1 protein ... MUC7 0.006 mucin 7, secreted precursor LOC100294249 0.006 PREDICTED: hypothetical protein XP_002344067 MUC7 0.006 mucin 7, secreted precursor MUC7 0.006 mucin 7, secreted precursor TNRC18 0.006 trinucleotide repeat containing 18 UBAP2L 0.006 ubiquitin associated protein 2-like isoform a [Homo... UBAP2L 0.006 ubiquitin associated protein 2-like isoform b [Homo... MLLT1 0.006 myeloid/lymphoid or mixed-lineage leukemia (trithora...Human BLASTP results (used to prepare the table) | |||
Gene descriptions are from NCBI RefSeq. Search results were obtained with NCBI BLAST and RefSeq entries. When identical proteins are present, the self-match may not be listed first in BLASTP output. In such cases, the table above has been reordered to place it first.
See About the Figures for the scoring system used in the figure above right. The same scoring system was used in the table of BLASTP results.
Guide to the Human Genome
Copyright © 2010 by Stewart Scherer. All rights reserved.
