| Name: STOX2 | Sequence: fasta or formatted (926aa) | NCBI GI: 55742730 | |
|
Description: storkhead box 2
|
Referenced in:
| ||
|
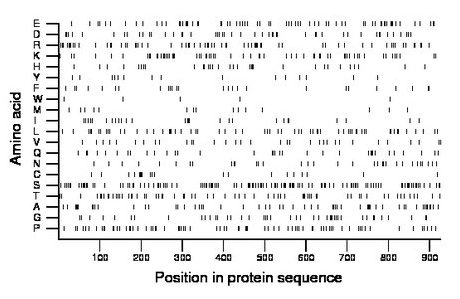
Composition:

Amino acid Percentage Count Longest homopolymer A alanine 5.9 55 2 C cysteine 2.2 20 2 D aspartate 5.4 50 4 E glutamate 7.6 70 3 F phenylalanine 2.8 26 1 G glycine 5.0 46 3 H histidine 3.6 33 2 I isoleucine 3.0 28 2 K lysine 7.0 65 2 L leucine 6.9 64 2 M methionine 1.7 16 1 N asparagine 3.6 33 1 P proline 8.1 75 2 Q glutamine 3.7 34 2 R arginine 7.1 66 2 S serine 13.6 126 3 T threonine 7.0 65 2 V valine 3.6 33 1 W tryptophan 0.5 5 1 Y tyrosine 1.7 16 2 |
Comparative genomics:
Search single species RefSeq proteins at NCBI
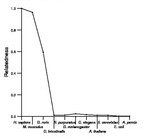
Search summary 
Figure data | ||
Related human proteins:Protein Relative score Description Self-match 1.000 storkhead box 2 STOX1 0.125 storkhead box 1 isoform a STOX1 0.125 storkhead box 1 isoform a STOX1 0.120 storkhead box 1 isoform d STOX1 0.056 storkhead box 1 isoform b STOX1 0.024 storkhead box 1 isoform c MED1 0.014 mediator complex subunit 1 NHS 0.013 Nance-Horan syndrome protein isoform 1 NHS 0.013 Nance-Horan syndrome protein isoform 2 CEP164 0.012 centrosomal protein 164kDa CDC2L5 0.012 cell division cycle 2-like 5 isoform 1 CDC2L5 0.012 cell division cycle 2-like 5 isoform 2 SFRS4 0.011 splicing factor, arginine/serine-rich 4 C2orf16 0.011 hypothetical protein LOC84226 NKTR 0.011 natural killer-tumor recognition sequence AP3D1 0.010 adaptor-related protein complex 3, delta 1 subunit ... DSPP 0.010 dentin sialophosphoprotein preproprotein HUWE1 0.010 HECT, UBA and WWE domain containing 1 TRAF3IP1 0.010 TNF receptor-associated factor 3 interacting protei... IWS1 0.010 IWS1 homolog NKAP 0.009 NFKB activating protein MAST4 0.009 microtubule associated serine/threonine kinase fami... SRRM2 0.009 splicing coactivator subunit SRm300 MARK2 0.009 MAP/microtubule affinity-regulating kinase 2 isoform... BPTF 0.009 bromodomain PHD finger transcription factor isoform ... BPTF 0.009 bromodomain PHD finger transcription factor isoform ... DPCR1 0.009 diffuse panbronchiolitis critical region 1 protein ... FHOD3 0.009 formin homology 2 domain containing 3 ATN1 0.009 atrophin-1 ATN1 0.009 atrophin-1Human BLASTP results (used to prepare the table) | |||
Gene descriptions are from NCBI RefSeq. Search results were obtained with NCBI BLAST and RefSeq entries. When identical proteins are present, the self-match may not be listed first in BLASTP output. In such cases, the table above has been reordered to place it first.
See About the Figures for the scoring system used in the figure above right. The same scoring system was used in the table of BLASTP results.
Guide to the Human Genome
Copyright © 2010 by Stewart Scherer. All rights reserved.
