
| Name: EFHD1 | Sequence: fasta or formatted (239aa) | NCBI GI: 20149496 | |
|
Description: EF-hand domain family, member D1
|
Referenced in:
| ||
|
Composition:
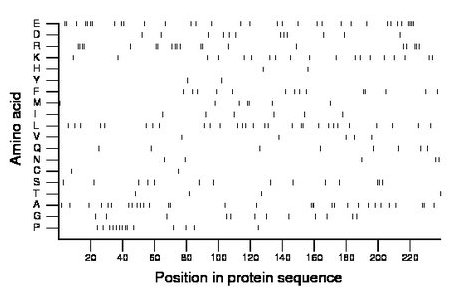
Amino acid Percentage Count Longest homopolymer A alanine 13.0 31 3 C cysteine 0.8 2 1 D aspartate 5.0 12 1 E glutamate 13.8 33 4 F phenylalanine 5.9 14 2 G glycine 5.0 12 1 H histidine 0.8 2 1 I isoleucine 2.5 6 1 K lysine 7.9 19 1 L leucine 12.1 29 2 M methionine 2.9 7 2 N asparagine 2.1 5 1 P proline 5.9 14 2 Q glutamine 3.3 8 1 R arginine 8.4 20 2 S serine 5.9 14 2 T threonine 1.7 4 1 V valine 2.1 5 1 W tryptophan 0.0 0 0 Y tyrosine 0.8 2 1 |
Comparative genomics:
Search single species RefSeq proteins at NCBI
Search summary 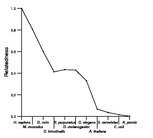
Figure data | ||
Related human proteins:Protein Relative score Description Self-match 1.000 EF-hand domain family, member D1 EFHD2 0.610 EF-hand domain family, member D2 AIF1L 0.070 ionized calcium binding adapter molecule 2 isoform 1... CETN2 0.066 caltractin CETN1 0.066 centrin 1 TNNC1 0.061 troponin C, slow AIF1 0.059 allograft inflammatory factor 1 isoform 3 AIF1 0.057 allograft inflammatory factor 1 isoform 1 TNNC2 0.057 fast skeletal muscle troponin C CALML5 0.052 calmodulin-like 5 CALM3 0.050 calmodulin 3 CALM2 0.050 calmodulin 2 CALM1 0.050 calmodulin 1 CALML3 0.048 calmodulin-like 3 MYL9 0.045 myosin regulatory light chain 9 isoform a AIF1 0.043 allograft inflammatory factor 1 isoform 2 CABP7 0.043 calcium binding protein 7 MYL12B 0.043 myosin regulatory light chain MRCL2 isoform A [Homo... MYL12B 0.043 myosin regulatory light chain MRCL2 isoform B [Homo... MYL12B 0.043 myosin regulatory light chain MRCL2 isoform A [Homo... MYL12B 0.043 myosin regulatory light chain MRCL2 isoform A CABP1 0.041 calcium binding protein 1 isoform 3 CABP1 0.041 calcium binding protein 1 isoform 2 CABP1 0.041 calcium binding protein 1 isoform 1 MYL12A 0.041 myosin, light chain 12A, regulatory, non-sarcomeric [... MYL5 0.041 myosin regulatory light chain 5 CETN3 0.041 centrin 3 CALML6 0.036 calmodulin-like 6 CALN1 0.034 calneuron 1 isoform 2 CALN1 0.034 calneuron 1 isoform 1Human BLASTP results (used to prepare the table) | |||
Gene descriptions are from NCBI RefSeq. Search results were obtained with NCBI BLAST and RefSeq entries. When identical proteins are present, the self-match may not be listed first in BLASTP output. In such cases, the table above has been reordered to place it first.
See About the Figures for the scoring system used in the figure above right. The same scoring system was used in the table of BLASTP results.
Guide to the Human Genome
Copyright © 2010 by Stewart Scherer. All rights reserved.
