
| Name: TPX2 | Sequence: fasta or formatted (747aa) | NCBI GI: 20127519 | |
|
Description: TPX2, microtubule-associated protein homolog
|
Referenced in: Spindle, M phase, and Meiosis
| ||
|
Composition:
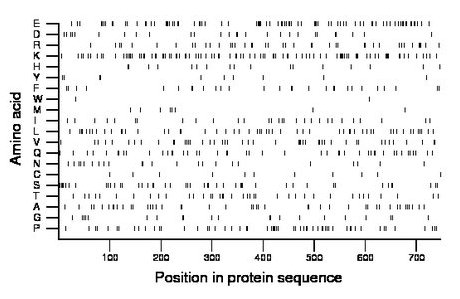
Amino acid Percentage Count Longest homopolymer A alanine 6.0 45 2 C cysteine 1.5 11 1 D aspartate 3.7 28 2 E glutamate 11.6 87 3 F phenylalanine 3.7 28 1 G glycine 2.9 22 2 H histidine 2.3 17 2 I isoleucine 4.0 30 2 K lysine 13.3 99 3 L leucine 7.4 55 2 M methionine 1.2 9 1 N asparagine 3.1 23 2 P proline 7.9 59 2 Q glutamine 6.4 48 2 R arginine 5.6 42 2 S serine 6.4 48 2 T threonine 5.1 38 1 V valine 6.2 46 2 W tryptophan 0.3 2 1 Y tyrosine 1.3 10 2 |
Comparative genomics:
Search single species RefSeq proteins at NCBI
Search summary 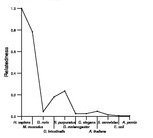
Figure data | ||
Related human proteins:Protein Relative score Description Self-match 1.000 TPX2, microtubule-associated protein homolog TCHH 0.027 trichohyalin NEFH 0.027 neurofilament, heavy polypeptide 200kDa TTN 0.025 titin isoform N2-A CALD1 0.020 caldesmon 1 isoform 1 MYH11 0.018 smooth muscle myosin heavy chain 11 isoform SM1A [Ho... MYH11 0.018 smooth muscle myosin heavy chain 11 isoform SM1B [Ho... MYH11 0.018 smooth muscle myosin heavy chain 11 isoform SM2B [Ho... MYH11 0.018 smooth muscle myosin heavy chain 11 isoform SM2A [Ho... GOLGA4 0.017 golgi autoantigen, golgin subfamily a, 4 CXorf15 0.016 gamma-taxilin PLEC1 0.016 plectin 1 isoform 11 PLEC1 0.016 plectin 1 isoform 10 PLEC1 0.016 plectin 1 isoform 8 PLEC1 0.016 plectin 1 isoform 7 PLEC1 0.016 plectin 1 isoform 6 PLEC1 0.016 plectin 1 isoform 3 PLEC1 0.016 plectin 1 isoform 2 PLEC1 0.016 plectin 1 isoform 1 TRDN 0.016 triadin CALD1 0.016 caldesmon 1 isoform 4 CALD1 0.016 caldesmon 1 isoform 3 HIP1R 0.015 huntingtin interacting protein-1-related LOC100294412 0.015 PREDICTED: similar to KIAA0655 protein MICALCL 0.014 MICAL C-terminal like LOC283685 0.014 PREDICTED: golgi autoantigen, golgin subfamily a-li... NEXN 0.014 nexilin (F actin binding protein) INCENP 0.014 inner centromere protein antigens 135/155kDa isofor... INCENP 0.014 inner centromere protein antigens 135/155kDa isofor... LOC283685 0.014 PREDICTED: golgi autoantigen, golgin subfamily a-li...Human BLASTP results (used to prepare the table) | |||
Gene descriptions are from NCBI RefSeq. Search results were obtained with NCBI BLAST and RefSeq entries. When identical proteins are present, the self-match may not be listed first in BLASTP output. In such cases, the table above has been reordered to place it first.
See About the Figures for the scoring system used in the figure above right. The same scoring system was used in the table of BLASTP results.
Guide to the Human Genome
Copyright © 2010 by Stewart Scherer. All rights reserved.
