
| Name: SPCS1 | Sequence: fasta or formatted (169aa) | NCBI GI: 193290128 | |
|
Description: signal peptidase complex subunit 1 homolog
|
Referenced in: ER, Golgi, and the Secretory Pathway
| ||
|
Composition:
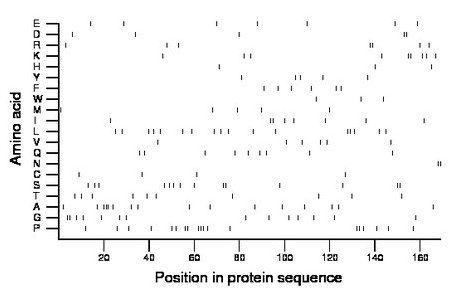
Amino acid Percentage Count Longest homopolymer A alanine 9.5 16 3 C cysteine 2.4 4 1 D aspartate 3.0 5 2 E glutamate 4.1 7 1 F phenylalanine 3.6 6 1 G glycine 8.3 14 2 H histidine 1.8 3 1 I isoleucine 4.7 8 2 K lysine 5.3 9 2 L leucine 10.1 17 2 M methionine 3.0 5 1 N asparagine 1.2 2 2 P proline 11.2 19 3 Q glutamine 5.3 9 1 R arginine 4.1 7 2 S serine 8.3 14 2 T threonine 5.9 10 1 V valine 3.6 6 1 W tryptophan 1.8 3 1 Y tyrosine 3.0 5 1 |
Comparative genomics:
Search single species RefSeq proteins at NCBI
Search summary 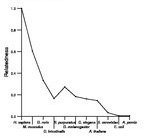
Figure data | ||
Related human proteins:Protein Relative score Description Self-match 1.000 signal peptidase complex subunit 1 homolog DNER 0.037 delta-notch-like EGF repeat-containing transmembran... TLX3 0.024 T-cell leukemia homeobox 3 FLJ22184 0.024 PREDICTED: hypothetical protein LOC80164 PPRC1 0.024 peroxisome proliferator-activated receptor gamma, co... FLJ22184 0.021 PREDICTED: hypothetical protein FLJ22184 C17orf56 0.021 hypothetical protein LOC146705 BAT2 0.021 HLA-B associated transcript-2 FLRT2 0.021 fibronectin leucine rich transmembrane protein 2 [Hom... SSPO 0.021 SCO-spondin FLJ22184 0.018 PREDICTED: hypothetical protein FLJ22184 LOC100292681 0.018 PREDICTED: hypothetical protein LOC100289011 0.018 PREDICTED: hypothetical protein XP_002343210 FAM22B 0.018 PREDICTED: hypothetical protein isoform 1 FAM22D 0.018 hypothetical protein LOC728130 C17orf59 0.018 hypothetical protein LOC54785 FAM22A 0.018 hypothetical protein LOC728118 NR5A1 0.018 nuclear receptor subfamily 5, group A, member 1 [Hom... KIAA1949 0.018 phostensin KIAA1949 0.018 phostensin C17orf39 0.018 hypothetical protein LOC79018 DIAPH1 0.015 diaphanous 1 isoform 2 DIAPH1 0.015 diaphanous 1 isoform 1 BAT2D1 0.015 HBxAg transactivated protein 2 LOC731551 0.015 PREDICTED: similar to ectonucleotide pyrophosphatas... LOC100293073 0.015 PREDICTED: hypothetical protein LOC650354 0.015 PREDICTED: similar to ectonucleotide pyrophosphatas... LOC100288439 0.015 PREDICTED: hypothetical protein XP_002343141 LOC100288686 0.015 PREDICTED: hypothetical protein XP_002342615 NCOR2 0.015 nuclear receptor co-repressor 2 isoform 2Human BLASTP results (used to prepare the table) | |||
Gene descriptions are from NCBI RefSeq. Search results were obtained with NCBI BLAST and RefSeq entries. When identical proteins are present, the self-match may not be listed first in BLASTP output. In such cases, the table above has been reordered to place it first.
See About the Figures for the scoring system used in the figure above right. The same scoring system was used in the table of BLASTP results.
Guide to the Human Genome
Copyright © 2010 by Stewart Scherer. All rights reserved.
