
| Name: PDCD1LG2 | Sequence: fasta or formatted (273aa) | NCBI GI: 190014605 | |
|
Description: programmed cell death 1 ligand 2
|
Referenced in: BCL2 Pathways, Caspases, and Programmed Cell Death
| ||
|
Composition:
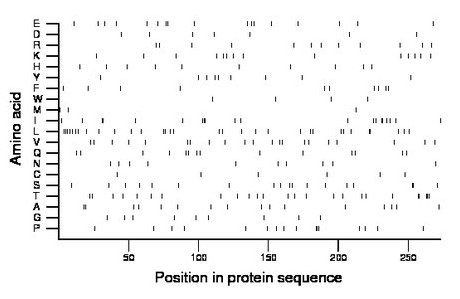
Amino acid Percentage Count Longest homopolymer A alanine 5.9 16 2 C cysteine 2.2 6 1 D aspartate 2.6 7 1 E glutamate 6.2 17 2 F phenylalanine 3.7 10 1 G glycine 3.3 9 1 H histidine 3.7 10 1 I isoleucine 7.3 20 3 K lysine 5.1 14 1 L leucine 11.7 32 3 M methionine 1.1 3 1 N asparagine 3.7 10 1 P proline 5.9 16 3 Q glutamine 5.1 14 1 R arginine 4.4 12 1 S serine 6.6 18 2 T threonine 9.2 25 3 V valine 7.7 21 1 W tryptophan 1.5 4 1 Y tyrosine 3.3 9 1 |
Comparative genomics:
Search single species RefSeq proteins at NCBI
Search summary 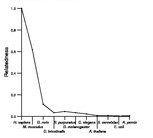
Figure data | ||
Related human proteins:Protein Relative score Description Self-match 1.000 programmed cell death 1 ligand 2 CD274 0.237 CD274 molecule CD276 0.087 CD276 antigen isoform a BTN3A2 0.087 butyrophilin, subfamily 3, member A2 precursor [Homo... BTN1A1 0.085 butyrophilin, subfamily 1, member A1 CD276 0.085 CD276 antigen isoform b BTN3A3 0.080 butyrophilin, subfamily 3, member A3 isoform a BTN3A3 0.066 butyrophilin, subfamily 3, member A3 isoform b [Homo... BTN3A1 0.065 butyrophilin, subfamily 3, member A1 isoform b [Homo... BTN3A1 0.065 butyrophilin, subfamily 3, member A1 isoform d [Hom... BTN3A1 0.065 butyrophilin, subfamily 3, member A1 isoform a [Homo... BTN2A2 0.055 butyrophilin, subfamily 2, member A2 isoform a ICOSLG 0.053 inducible T-cell co-stimulator ligand BTN2A1 0.049 butyrophilin, subfamily 2, member A1 isoform 1 precur... BTN2A1 0.049 butyrophilin, subfamily 2, member A1 isoform 2 precu... LRIG1 0.038 leucine-rich repeats and immunoglobulin-like domains... HMCN2 0.034 PREDICTED: hemicentin 2 HMCN2 0.034 PREDICTED: hemicentin 2 HMCN2 0.034 PREDICTED: hemicentin 2 HMCN1 0.034 hemicentin 1 CADM2 0.034 immunoglobulin superfamily, member 4D BTN3A1 0.034 butyrophilin, subfamily 3, member A1 isoform c [Hom... HSPG2 0.032 heparan sulfate proteoglycan 2 VTCN1 0.030 V-set domain containing T cell activation inhibitor ... MUSK 0.030 skeletal muscle receptor tyrosine kinase CD80 0.028 CD80 antigen precursor CD200 0.028 CD200 antigen isoform b CD200 0.028 CD200 antigen isoform a precursor TAPBPL 0.028 TAP binding protein-like MXRA5 0.028 adlicanHuman BLASTP results (used to prepare the table) | |||
Gene descriptions are from NCBI RefSeq. Search results were obtained with NCBI BLAST and RefSeq entries. When identical proteins are present, the self-match may not be listed first in BLASTP output. In such cases, the table above has been reordered to place it first.
See About the Figures for the scoring system used in the figure above right. The same scoring system was used in the table of BLASTP results.
Guide to the Human Genome
Copyright © 2010 by Stewart Scherer. All rights reserved.
