
| Name: ICOSLG | Sequence: fasta or formatted (302aa) | NCBI GI: 27477039 | |
|
Description: inducible T-cell co-stimulator ligand
|
Referenced in:
| ||
|
Composition:
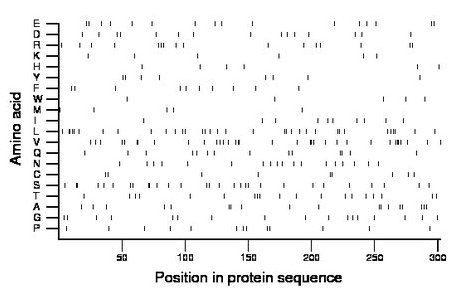
Amino acid Percentage Count Longest homopolymer A alanine 6.0 18 2 C cysteine 3.0 9 2 D aspartate 5.0 15 1 E glutamate 5.3 16 1 F phenylalanine 3.3 10 1 G glycine 5.6 17 1 H histidine 2.0 6 1 I isoleucine 3.3 10 1 K lysine 2.0 6 1 L leucine 11.3 34 2 M methionine 1.7 5 1 N asparagine 6.0 18 1 P proline 4.3 13 1 Q glutamine 4.6 14 2 R arginine 5.3 16 1 S serine 9.6 29 2 T threonine 6.3 19 1 V valine 11.3 34 3 W tryptophan 1.7 5 1 Y tyrosine 2.6 8 1 |
Comparative genomics:
Search single species RefSeq proteins at NCBI
Search summary 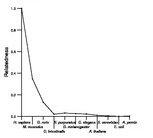
Figure data | ||
Related human proteins:Protein Relative score Description Self-match 1.000 inducible T-cell co-stimulator ligand CD276 0.135 CD276 antigen isoform b CD276 0.127 CD276 antigen isoform a BTN1A1 0.070 butyrophilin, subfamily 1, member A1 CD86 0.060 CD86 antigen isoform 2 precursor CD86 0.060 CD86 antigen isoform 1 CD80 0.060 CD80 antigen precursor BTNL8 0.055 butyrophilin-like 8 isoform 4 precursor BTNL8 0.055 butyrophilin-like 8 isoform 2 precursor BTNL8 0.055 butyrophilin-like 8 isoform 1 precursor CD274 0.055 CD274 molecule BTNL2 0.055 butyrophilin-like 2 HHLA2 0.053 HERV-H LTR-associating 2 BTN3A2 0.051 butyrophilin, subfamily 3, member A2 precursor [Homo... PDCD1LG2 0.048 programmed cell death 1 ligand 2 VTCN1 0.046 V-set domain containing T cell activation inhibitor ... BTN3A1 0.046 butyrophilin, subfamily 3, member A1 isoform b [Homo... BTN3A1 0.046 butyrophilin, subfamily 3, member A1 isoform d [Hom... BTN3A1 0.046 butyrophilin, subfamily 3, member A1 isoform a [Homo... BTN3A3 0.043 butyrophilin, subfamily 3, member A3 isoform a BTN3A3 0.039 butyrophilin, subfamily 3, member A3 isoform b [Homo... BTN2A1 0.039 butyrophilin, subfamily 2, member A1 isoform 1 precur... BTN2A1 0.039 butyrophilin, subfamily 2, member A1 isoform 2 precu... BTN2A2 0.036 butyrophilin, subfamily 2, member A2 isoform a BTNL9 0.034 butyrophilin-like 9 MCAM 0.033 melanoma cell adhesion molecule CD200 0.029 CD200 antigen isoform b CD200 0.029 CD200 antigen isoform a precursor SIRPA 0.029 signal-regulatory protein alpha precursor SIRPA 0.029 signal-regulatory protein alpha precursorHuman BLASTP results (used to prepare the table) | |||
Gene descriptions are from NCBI RefSeq. Search results were obtained with NCBI BLAST and RefSeq entries. When identical proteins are present, the self-match may not be listed first in BLASTP output. In such cases, the table above has been reordered to place it first.
See About the Figures for the scoring system used in the figure above right. The same scoring system was used in the table of BLASTP results.
Guide to the Human Genome
Copyright © 2010 by Stewart Scherer. All rights reserved.
