
| Name: CDCA5 | Sequence: fasta or formatted (252aa) | NCBI GI: 18087845 | |
|
Description: cell division cycle associated 5
|
Referenced in: Additional Cell Cycle Functions
| ||
|
Composition:
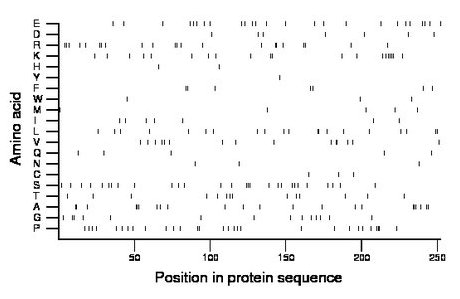
Amino acid Percentage Count Longest homopolymer A alanine 8.7 22 3 C cysteine 1.2 3 1 D aspartate 2.8 7 1 E glutamate 9.9 25 1 F phenylalanine 2.8 7 2 G glycine 5.6 14 2 H histidine 0.8 2 1 I isoleucine 2.8 7 1 K lysine 7.9 20 4 L leucine 7.9 20 2 M methionine 2.0 5 1 N asparagine 1.2 3 1 P proline 11.5 29 3 Q glutamine 2.0 5 1 R arginine 8.7 22 2 S serine 11.1 28 3 T threonine 5.6 14 1 V valine 6.0 15 2 W tryptophan 1.2 3 1 Y tyrosine 0.4 1 1 |
Comparative genomics:
Search single species RefSeq proteins at NCBI
Search summary 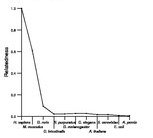
Figure data | ||
Related human proteins:Protein Relative score Description Self-match 1.000 cell division cycle associated 5 SFRS2IP 0.036 splicing factor, arginine/serine-rich 2, interactin... MAVS 0.027 virus-induced signaling adapter FLJ22184 0.025 PREDICTED: hypothetical protein FLJ22184 LOC100129852 0.025 PREDICTED: hypothetical protein LOC100129852 0.025 PREDICTED: hypothetical protein LOC100129852 0.025 PREDICTED: hypothetical protein MYO15A 0.021 myosin XV SRRM1 0.021 serine/arginine repetitive matrix 1 ZNF207 0.021 zinc finger protein 207 isoform b ROBO1 0.021 roundabout 1 isoform d ROBO1 0.021 roundabout 1 isoform c ROBO1 0.021 roundabout 1 isoform b ROBO1 0.021 roundabout 1 isoform a NACA 0.021 nascent polypeptide-associated complex alpha subuni... LOC642132 0.019 PREDICTED: similar to roundabout 1 isoform 1 LOC642132 0.019 PREDICTED: similar to roundabout 1 isoform 2 EHBP1 0.017 EH domain binding protein 1 isoform 3 EHBP1 0.017 EH domain binding protein 1 isoform 3 EHBP1 0.017 EH domain binding protein 1 isoform 2 EHBP1 0.017 EH domain binding protein 1 isoform 1 PRG4 0.017 proteoglycan 4 isoform D PRG4 0.017 proteoglycan 4 isoform C PRG4 0.017 proteoglycan 4 isoform B PRG4 0.017 proteoglycan 4 isoform A FAM129A 0.017 niban protein isoform 2 ZNF750 0.017 zinc finger protein 750 MSL3 0.017 male-specific lethal 3-like 1 isoform a MSL3 0.017 male-specific lethal 3-like 1 isoform c MSL3 0.017 male-specific lethal 3-like 1 isoform bHuman BLASTP results (used to prepare the table) | |||
Gene descriptions are from NCBI RefSeq. Search results were obtained with NCBI BLAST and RefSeq entries. When identical proteins are present, the self-match may not be listed first in BLASTP output. In such cases, the table above has been reordered to place it first.
See About the Figures for the scoring system used in the figure above right. The same scoring system was used in the table of BLASTP results.
Guide to the Human Genome
Copyright © 2010 by Stewart Scherer. All rights reserved.
