
| Name: USPL1 | Sequence: fasta or formatted (1092aa) | NCBI GI: 171460956 | |
|
Description: ubiquitin specific peptidase like 1
| Not currently referenced in the text | ||
|
Composition:
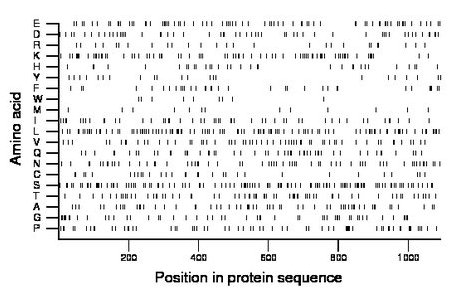
Amino acid Percentage Count Longest homopolymer A alanine 5.7 62 2 C cysteine 2.8 31 1 D aspartate 5.0 55 2 E glutamate 7.1 77 2 F phenylalanine 3.2 35 2 G glycine 4.9 53 2 H histidine 3.0 33 1 I isoleucine 4.6 50 1 K lysine 7.4 81 3 L leucine 10.3 112 3 M methionine 1.4 15 2 N asparagine 6.0 66 2 P proline 6.0 65 3 Q glutamine 4.7 51 2 R arginine 2.5 27 1 S serine 10.8 118 3 T threonine 6.5 71 3 V valine 5.4 59 2 W tryptophan 0.8 9 1 Y tyrosine 2.0 22 1 |
Comparative genomics:
Search single species RefSeq proteins at NCBI
Search summary 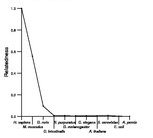
Figure data | ||
Related human proteins:Protein Relative score Description Self-match 1.000 ubiquitin specific peptidase like 1 CKAP4 0.008 cytoskeleton-associated protein 4 NCOR1 0.007 nuclear receptor co-repressor 1 MYST4 0.006 MYST histone acetyltransferase (monocytic leukemia)... BAT2D1 0.006 HBxAg transactivated protein 2 SULT1C2 0.006 sulfotransferase family, cytosolic, 1C, member 1 iso... SULT1C2 0.006 sulfotransferase family, cytosolic, 1C, member 1 isof... CAMTA1 0.005 calmodulin-binding transcription activator 1 UBR1 0.005 ubiquitin protein ligase E3 component n-recognin 1 [... MICALCL 0.005 MICAL C-terminal like ZEB1 0.005 zinc finger E-box binding homeobox 1 isoform a [Hom... ZEB1 0.005 zinc finger E-box binding homeobox 1 isoform b [Hom... MUC4 0.005 mucin 4 isoform a LOC100131514 0.005 PREDICTED: similar to hCG1747327, partial RDX 0.005 radixin C2orf78 0.005 hypothetical protein LOC388960 LOC100293644 0.004 PREDICTED: hypothetical protein LOC100287563 0.004 PREDICTED: hypothetical protein LOC100287563 0.004 PREDICTED: hypothetical protein XP_002343733 ATF7IP 0.004 activating transcription factor 7 interacting protei... PCGF2 0.004 ring finger protein 110 EDC4 0.004 autoantigen RCD8 MUC16 0.004 mucin 16 CENPE 0.004 centromere protein E AKAP8 0.004 A-kinase anchor protein 8 IQCE 0.004 IQ motif containing E isoform 1 IQCE 0.004 IQ motif containing E isoform 2 SMAD6 0.004 SMAD family member 6 isoform 1 REST 0.004 RE1-silencing transcription factor STAC3 0.004 SH3 and cysteine rich domain 3Human BLASTP results (used to prepare the table) | |||
Gene descriptions are from NCBI RefSeq. Search results were obtained with NCBI BLAST and RefSeq entries. When identical proteins are present, the self-match may not be listed first in BLASTP output. In such cases, the table above has been reordered to place it first.
See About the Figures for the scoring system used in the figure above right. The same scoring system was used in the table of BLASTP results.
Guide to the Human Genome
Copyright © 2010 by Stewart Scherer. All rights reserved.
