
| Name: STAC3 | Sequence: fasta or formatted (364aa) | NCBI GI: 21450838 | |
|
Description: SH3 and cysteine rich domain 3
|
Referenced in: Non-Receptor Tyrosine Kinase Pathways
| ||
|
Composition:
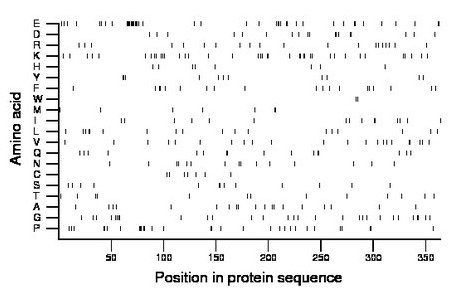
Amino acid Percentage Count Longest homopolymer A alanine 5.2 19 2 C cysteine 1.9 7 1 D aspartate 4.9 18 2 E glutamate 11.8 43 12 F phenylalanine 5.2 19 2 G glycine 8.0 29 3 H histidine 2.2 8 1 I isoleucine 4.1 15 2 K lysine 10.7 39 2 L leucine 4.9 18 2 M methionine 1.9 7 2 N asparagine 4.1 15 2 P proline 8.2 30 3 Q glutamine 4.4 16 2 R arginine 5.5 20 1 S serine 3.6 13 2 T threonine 3.6 13 1 V valine 6.0 22 2 W tryptophan 0.5 2 2 Y tyrosine 3.0 11 2 |
Comparative genomics:
Search single species RefSeq proteins at NCBI
Search summary 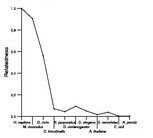
Figure data | ||
Related human proteins:Protein Relative score Description Self-match 1.000 SH3 and cysteine rich domain 3 STAC 0.285 SH3 and cysteine rich domain STAC2 0.251 SH3 and cysteine rich domain 2 GRAP2 0.048 GRB2-related adaptor protein 2 STAM 0.045 signal transducing adaptor molecule 1 NCF2 0.042 neutrophil cytosolic factor 2 NCF2 0.042 neutrophil cytosolic factor 2 DNMBP 0.042 dynamin binding protein STAM2 0.041 signal transducing adaptor molecule 2 SH3YL1 0.041 SH3 domain containing, Ysc84-like 1 isoform 2 [Homo... SH3YL1 0.041 SH3 domain containing, Ysc84-like 1 isoform 1 [Homo... ITSN2 0.040 intersectin 2 isoform 3 ITSN2 0.040 intersectin 2 isoform 1 ITSN2 0.040 intersectin 2 isoform 2 ITSN1 0.038 intersectin 1 isoform ITSN-s ITSN1 0.038 intersectin 1 isoform ITSN-l PRKCH 0.037 protein kinase C, eta PRKCQ 0.035 protein kinase C, theta PRKCE 0.035 protein kinase C, epsilon PRKCD 0.034 protein kinase C, delta PRKCD 0.034 protein kinase C, delta FRK 0.034 fyn-related kinase BTK 0.033 Bruton agammaglobulinemia tyrosine kinase LYN 0.033 Yamaguchi sarcoma viral (v-yes-1) oncogene homolog is... CTTN 0.033 cortactin isoform a CTTN 0.033 cortactin isoform b LYN 0.033 Yamaguchi sarcoma viral (v-yes-1) oncogene homolog ... CD2AP 0.033 CD2-associated protein PRKD3 0.031 protein kinase D3 RASGRP1 0.031 RAS guanyl releasing protein 1 isoform bHuman BLASTP results (used to prepare the table) | |||
Gene descriptions are from NCBI RefSeq. Search results were obtained with NCBI BLAST and RefSeq entries. When identical proteins are present, the self-match may not be listed first in BLASTP output. In such cases, the table above has been reordered to place it first.
See About the Figures for the scoring system used in the figure above right. The same scoring system was used in the table of BLASTP results.
Guide to the Human Genome
Copyright © 2010 by Stewart Scherer. All rights reserved.
