
| Name: PLA2G2C | Sequence: fasta or formatted (150aa) | NCBI GI: 157743243 | |
|
Description: phospholipase A2, group IIC
|
Referenced in:
| ||
|
Composition:
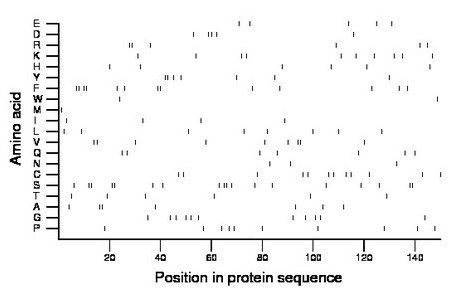
Amino acid Percentage Count Longest homopolymer A alanine 4.7 7 2 C cysteine 8.0 12 1 D aspartate 3.3 5 2 E glutamate 3.3 5 1 F phenylalanine 8.7 13 2 G glycine 7.3 11 1 H histidine 4.0 6 1 I isoleucine 2.7 4 1 K lysine 6.7 10 1 L leucine 5.3 8 1 M methionine 0.7 1 1 N asparagine 2.0 3 1 P proline 6.7 10 1 Q glutamine 4.7 7 1 R arginine 4.0 6 2 S serine 12.0 18 2 T threonine 4.0 6 1 V valine 6.0 9 2 W tryptophan 1.3 2 1 Y tyrosine 4.7 7 2 |
Comparative genomics:
Search single species RefSeq proteins at NCBI
Search summary 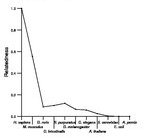
Figure data | ||
Related human proteins:Protein Relative score Description Self-match 1.000 phospholipase A2, group IIC PLA2G2D 0.180 phospholipase A2, group IID PLA2G2A 0.180 phospholipase A2, group IIA precursor PLA2G2A 0.180 phospholipase A2, group IIA precursor PLA2G2A 0.180 phospholipase A2, group IIA precursor PLA2G2A 0.180 phospholipase A2, group IIA precursor PLA2G2E 0.176 phospholipase A2, group IIE PLA2G2F 0.167 phospholipase A2, group IIF PLA2G5 0.167 phospholipase A2, group V precursor PLA2G1B 0.141 phospholipase A2 group IB PLA2G10 0.105 phospholipase A2, group X OC90 0.056 otoconin 90 HS6ST1 0.029 heparan sulfate 6-O-sulfotransferase 1 RPAIN 0.023 RPA interacting protein isoform a KIAA0892 0.023 hypothetical protein LOC23383 CACNA1H 0.020 calcium channel, voltage-dependent, T type, alpha 1H... CACNA1H 0.020 calcium channel, voltage-dependent, T type, alpha 1H... LAMB2 0.016 laminin, beta 2 precursor MUC12 0.013 PREDICTED: mucin 12 MUC12 0.013 PREDICTED: mucin 12 MUC12 0.013 PREDICTED: mucin 12 MUC12 0.013 PREDICTED: mucin 12, cell surface associated RPAIN 0.013 RPA interacting protein isoform b SSPO 0.013 SCO-spondin NBEAL1 0.010 neurobeachin-like 1 isoform 3 NBEAL1 0.010 neurobeachin-like 1 isoform 2 NBEAL1 0.010 neurobeachin-like 1 isoform 1 FBN3 0.010 fibrillin 3 precursor CRB1 0.010 crumbs homolog 1 precursor TEK 0.010 TEK tyrosine kinase, endothelial precursorHuman BLASTP results (used to prepare the table) | |||
Gene descriptions are from NCBI RefSeq. Search results were obtained with NCBI BLAST and RefSeq entries. When identical proteins are present, the self-match may not be listed first in BLASTP output. In such cases, the table above has been reordered to place it first.
See About the Figures for the scoring system used in the figure above right. The same scoring system was used in the table of BLASTP results.
Guide to the Human Genome
Copyright © 2010 by Stewart Scherer. All rights reserved.
