
| Name: TBP | Sequence: fasta or formatted (339aa) | NCBI GI: 4507379 | |
|
Description: TATA box binding protein
|
Referenced in: Cerebellum
| ||
|
Composition:
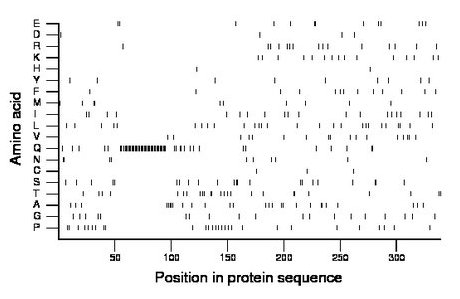
Amino acid Percentage Count Longest homopolymer A alanine 8.0 27 4 C cysteine 0.9 3 1 D aspartate 1.2 4 1 E glutamate 3.8 13 2 F phenylalanine 3.8 13 1 G glycine 5.6 19 1 H histidine 0.6 2 1 I isoleucine 5.9 20 1 K lysine 4.4 15 1 L leucine 8.0 27 2 M methionine 2.9 10 2 N asparagine 2.9 10 2 P proline 8.3 28 2 Q glutamine 17.7 60 38 R arginine 4.4 15 1 S serine 6.5 22 2 T threonine 7.4 25 2 V valine 5.0 17 2 W tryptophan 0.0 0 0 Y tyrosine 2.7 9 1 |
Comparative genomics:
Search single species RefSeq proteins at NCBI
Search summary 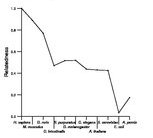
Figure data | ||
Related human proteins:Protein Relative score Description Self-match 1.000 TATA box binding protein TBPL2 0.536 TATA box binding protein like 2 TBPL1 0.174 TBP-like 1 MAML2 0.107 mastermind-like 2 FOXP2 0.098 forkhead box P2 isoform I FOXP2 0.098 forkhead box P2 isoform III FOXP2 0.098 forkhead box P2 isoform II MED12 0.098 mediator complex subunit 12 NCOA6 0.084 nuclear receptor coactivator 6 MLL2 0.083 myeloid/lymphoid or mixed-lineage leukemia 2 BMP2K 0.081 BMP-2 inducible kinase isoform a BMP2K 0.081 BMP-2 inducible kinase isoform b THAP11 0.081 THAP domain containing 11 NCOA3 0.073 nuclear receptor coactivator 3 isoform b SMARCA2 0.073 SWI/SNF-related matrix-associated actin-dependent re... SMARCA2 0.073 SWI/SNF-related matrix-associated actin-dependent re... MED15 0.073 mediator complex subunit 15 isoform a MED15 0.073 mediator complex subunit 15 isoform b NCOA3 0.070 nuclear receptor coactivator 3 isoform a ATXN1 0.070 ataxin 1 ATXN1 0.070 ataxin 1 EP400 0.070 E1A binding protein p400 MAML3 0.069 mastermind-like 3 TOX3 0.065 TOX high mobility group box family member 3 isoform... TOX3 0.065 TOX high mobility group box family member 3 isoform... MN1 0.065 meningioma 1 AR 0.065 androgen receptor isoform 1 FRMPD3 0.061 PREDICTED: FERM and PDZ domain containing 3 FRMPD3 0.061 PREDICTED: FERM and PDZ domain containing 3 FRMPD3 0.061 PREDICTED: FERM and PDZ domain containing 3Human BLASTP results (used to prepare the table) | |||
Gene descriptions are from NCBI RefSeq. Search results were obtained with NCBI BLAST and RefSeq entries. When identical proteins are present, the self-match may not be listed first in BLASTP output. In such cases, the table above has been reordered to place it first.
See About the Figures for the scoring system used in the figure above right. The same scoring system was used in the table of BLASTP results.
Guide to the Human Genome
Copyright © 2010 by Stewart Scherer. All rights reserved.
