
| Name: MNT | Sequence: fasta or formatted (582aa) | NCBI GI: 9945318 | |
|
Description: MAX binding protein
|
Referenced in:
| ||
|
Composition:
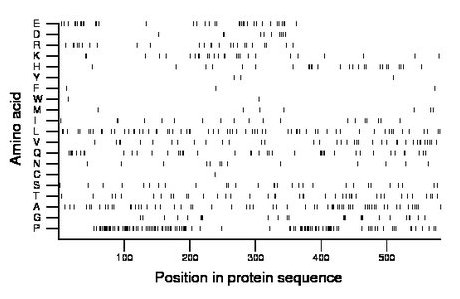
Amino acid Percentage Count Longest homopolymer A alanine 10.8 63 3 C cysteine 0.2 1 1 D aspartate 1.9 11 2 E glutamate 6.4 37 2 F phenylalanine 0.5 3 1 G glycine 4.3 25 3 H histidine 4.6 27 2 I isoleucine 3.3 19 1 K lysine 4.5 26 2 L leucine 11.0 64 2 M methionine 1.4 8 1 N asparagine 2.2 13 1 P proline 17.9 104 5 Q glutamine 7.6 44 4 R arginine 4.3 25 2 S serine 5.2 30 2 T threonine 6.9 40 2 V valine 6.4 37 2 W tryptophan 0.3 2 1 Y tyrosine 0.5 3 1 |
Comparative genomics:
Search single species RefSeq proteins at NCBI
Search summary 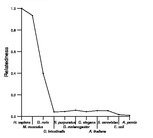
Figure data | ||
Related human proteins:Protein Relative score Description Self-match 1.000 MAX binding protein RAPH1 0.054 Ras association and pleckstrin homology domains 1 is... DIAPH1 0.053 diaphanous 1 isoform 2 DIAPH1 0.053 diaphanous 1 isoform 1 WNK2 0.049 WNK lysine deficient protein kinase 2 BCORL1 0.049 BCL6 co-repressor-like 1 FLJ22184 0.048 PREDICTED: hypothetical protein FLJ22184 MLL4 0.047 myeloid/lymphoid or mixed-lineage leukemia 4 FLJ22184 0.047 PREDICTED: hypothetical protein FLJ22184 FLJ22184 0.047 PREDICTED: hypothetical protein LOC80164 WIPF3 0.047 WAS/WASL interacting protein family, member 3 [Homo... WBP11 0.047 WW domain binding protein 11 WASF1 0.045 Wiskott-Aldrich syndrome protein family member 1 [Ho... WASF1 0.045 Wiskott-Aldrich syndrome protein family member 1 [Ho... WASF1 0.045 Wiskott-Aldrich syndrome protein family member 1 [Ho... WASF1 0.045 Wiskott-Aldrich syndrome protein family member 1 [Hom... WASF2 0.045 WAS protein family, member 2 FMN2 0.043 formin 2 DGKK 0.043 diacylglycerol kinase kappa PRR12 0.043 proline rich 12 INF2 0.041 inverted formin 2 isoform 2 INF2 0.041 inverted formin 2 isoform 1 SAMD1 0.041 sterile alpha motif domain containing 1 PRG4 0.041 proteoglycan 4 isoform D PRG4 0.041 proteoglycan 4 isoform C PRG4 0.041 proteoglycan 4 isoform B PRG4 0.041 proteoglycan 4 isoform A PELP1 0.039 proline, glutamic acid and leucine rich protein 1 [... YLPM1 0.039 YLP motif containing 1 TTN 0.038 titin isoform N2-AHuman BLASTP results (used to prepare the table) | |||
Gene descriptions are from NCBI RefSeq. Search results were obtained with NCBI BLAST and RefSeq entries. When identical proteins are present, the self-match may not be listed first in BLASTP output. In such cases, the table above has been reordered to place it first.
See About the Figures for the scoring system used in the figure above right. The same scoring system was used in the table of BLASTP results.
Guide to the Human Genome
Copyright © 2010 by Stewart Scherer. All rights reserved.
