
| Name: MAP1A | Sequence: fasta or formatted (2803aa) | NCBI GI: 95147555 | |
|
Description: microtubule-associated protein 1A
|
Referenced in:
| ||
|
Composition:
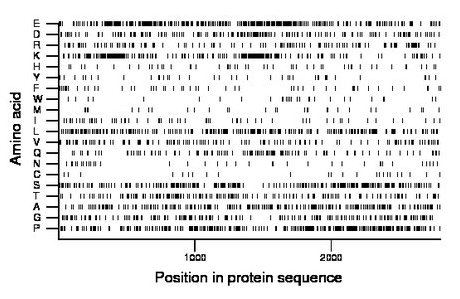
Amino acid Percentage Count Longest homopolymer A alanine 8.1 226 3 C cysteine 0.9 26 2 D aspartate 5.9 164 2 E glutamate 12.3 346 6 F phenylalanine 1.8 51 2 G glycine 6.4 179 2 H histidine 1.9 52 2 I isoleucine 2.3 64 2 K lysine 7.5 211 2 L leucine 8.1 227 3 M methionine 1.1 31 2 N asparagine 1.4 40 1 P proline 11.5 323 3 Q glutamine 4.1 115 4 R arginine 4.6 129 3 S serine 9.3 261 3 T threonine 5.7 159 2 V valine 4.7 132 2 W tryptophan 1.0 28 1 Y tyrosine 1.4 39 2 |
Comparative genomics:
Search single species RefSeq proteins at NCBI
Search summary 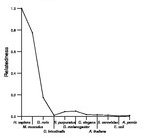
Figure data | ||
Related human proteins:Protein Relative score Description Self-match 1.000 microtubule-associated protein 1A MAP1B 0.116 microtubule-associated protein 1B MAP1S 0.048 BPY2 interacting protein 1 LOC283685 0.021 PREDICTED: golgi autoantigen, golgin subfamily a-li... TTN 0.020 titin isoform N2-A LOC727832 0.020 golgi autoantigen, golgin subfamily a-like LOC283685 0.020 PREDICTED: golgi autoantigen, golgin subfamily a-li... LOC440243 0.019 PREDICTED: Putative golgin subfamily A member 6-lik... NACA 0.019 nascent polypeptide-associated complex alpha subuni... LOC283767 0.019 golgi autoantigen, golgin subfamily a-like LOC400352 0.018 PREDICTED: similar to Putative golgin subfamily A m... LOC100132816 0.018 PREDICTED: similar to Putative golgin subfamily A m... LOC100133758 0.017 PREDICTED: hypothetical protein, partial MLL2 0.017 myeloid/lymphoid or mixed-lineage leukemia 2 LOC645202 0.016 PREDICTED: hypothetical protein LOC645202 KDM6B 0.015 lysine (K)-specific demethylase 6B NEFH 0.014 neurofilament, heavy polypeptide 200kDa PRG4 0.014 proteoglycan 4 isoform D PRG4 0.014 proteoglycan 4 isoform C PRG4 0.014 proteoglycan 4 isoform B PRG4 0.014 proteoglycan 4 isoform A LOC651807 0.012 PREDICTED: hypothetical protein ZNF469 0.012 zinc finger protein 469 FLJ22184 0.012 PREDICTED: hypothetical protein FLJ22184 C6orf132 0.012 PREDICTED: chromosome 6 open reading frame 132 [Hom... C6orf132 0.012 PREDICTED: chromosome 6 open reading frame 132 [Hom... C6orf132 0.012 PREDICTED: hypothetical protein LOC647024 WDR87 0.012 NYD-SP11 protein LOC100133220 0.012 PREDICTED: hypothetical protein PCLO 0.012 piccolo isoform 2Human BLASTP results (used to prepare the table) | |||
Gene descriptions are from NCBI RefSeq. Search results were obtained with NCBI BLAST and RefSeq entries. When identical proteins are present, the self-match may not be listed first in BLASTP output. In such cases, the table above has been reordered to place it first.
See About the Figures for the scoring system used in the figure above right. The same scoring system was used in the table of BLASTP results.
Guide to the Human Genome
Copyright © 2010 by Stewart Scherer. All rights reserved.
