
| Name: PHC1 | Sequence: fasta or formatted (1004aa) | NCBI GI: 62953127 | |
|
Description: polyhomeotic 1-like
|
Referenced in: Stem Cells and Early Development
| ||
|
Composition:
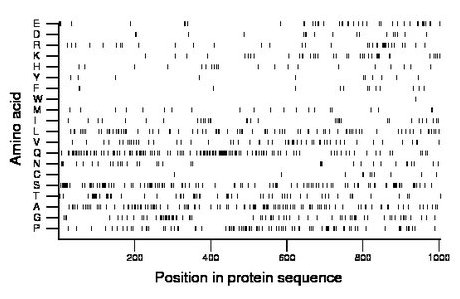
Amino acid Percentage Count Longest homopolymer A alanine 11.2 112 3 C cysteine 1.1 11 1 D aspartate 1.7 17 2 E glutamate 4.2 42 3 F phenylalanine 1.3 13 1 G glycine 7.3 73 4 H histidine 2.1 21 2 I isoleucine 3.2 32 2 K lysine 3.8 38 2 L leucine 8.3 83 4 M methionine 2.2 22 1 N asparagine 3.4 34 1 P proline 9.3 93 3 Q glutamine 13.4 135 15 R arginine 3.5 35 3 S serine 11.3 113 4 T threonine 6.0 60 4 V valine 5.8 58 2 W tryptophan 0.1 1 1 Y tyrosine 1.1 11 1 |
Comparative genomics:
Search single species RefSeq proteins at NCBI
Search summary 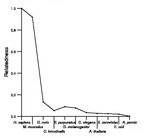
Figure data | ||
Related human proteins:Protein Relative score Description Self-match 1.000 polyhomeotic 1-like PHC2 0.173 polyhomeotic-like 2 isoform a PHC3 0.137 polyhomeotic like 3 PHC2 0.120 polyhomeotic-like 2 isoform b MED15 0.052 mediator complex subunit 15 isoform b MED15 0.051 mediator complex subunit 15 isoform a MLL2 0.036 myeloid/lymphoid or mixed-lineage leukemia 2 EP400 0.030 E1A binding protein p400 ARID1A 0.029 AT rich interactive domain 1A isoform a ARID1A 0.029 AT rich interactive domain 1A isoform b MED12 0.027 mediator complex subunit 12 MAML2 0.026 mastermind-like 2 NFAT5 0.026 nuclear factor of activated T-cells 5 isoform a [Hom... NFAT5 0.026 nuclear factor of activated T-cells 5 isoform c [Homo... NFAT5 0.026 nuclear factor of activated T-cells 5 isoform d [Ho... NFAT5 0.026 nuclear factor of activated T-cells 5 isoform b [Ho... NFAT5 0.026 nuclear factor of activated T-cells 5 isoform a [Hom... FOXP2 0.026 forkhead box P2 isoform I FOXP2 0.026 forkhead box P2 isoform II FOXP2 0.025 forkhead box P2 isoform III SFMBT1 0.024 Scm-like with four mbt domains 1 SFMBT1 0.024 Scm-like with four mbt domains 1 SFMBT1 0.024 Scm-like with four mbt domains 1 SAMD7 0.024 sterile alpha motif domain containing 7 L3MBTL3 0.023 l(3)mbt-like 3 isoform b L3MBTL3 0.023 l(3)mbt-like 3 isoform a L3MBTL4 0.023 l(3)mbt-like 4 NCOA6 0.023 nuclear receptor coactivator 6 TSC22D1 0.023 TSC22 domain family, member 1 isoform 1 SAMD11 0.023 sterile alpha motif domain containing 11Human BLASTP results (used to prepare the table) | |||
Gene descriptions are from NCBI RefSeq. Search results were obtained with NCBI BLAST and RefSeq entries. When identical proteins are present, the self-match may not be listed first in BLASTP output. In such cases, the table above has been reordered to place it first.
See About the Figures for the scoring system used in the figure above right. The same scoring system was used in the table of BLASTP results.
Guide to the Human Genome
Copyright © 2010 by Stewart Scherer. All rights reserved.
