
| Name: RGR | Sequence: fasta or formatted (253aa) | NCBI GI: 61744452 | |
|
Description: retinal G-protein coupled receptor isoform 3
|
Referenced in: Photoreceptors and Related Functions
| ||
Other entries for this name:
alt prot [295aa] retinal G-protein coupled receptor isoform 1 alt prot [291aa] retinal G-protein coupled receptor isoform 2 | |||
|
Composition:
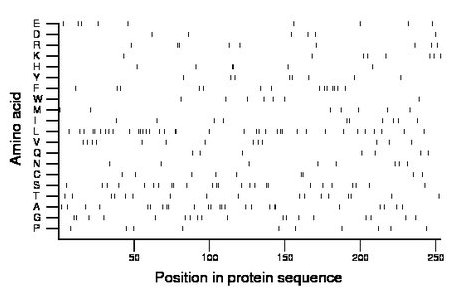
Amino acid Percentage Count Longest homopolymer A alanine 9.9 25 2 C cysteine 3.6 9 2 D aspartate 2.4 6 1 E glutamate 3.6 9 1 F phenylalanine 5.5 14 2 G glycine 7.1 18 1 H histidine 2.4 6 2 I isoleucine 4.0 10 1 K lysine 3.2 8 1 L leucine 14.6 37 2 M methionine 2.8 7 1 N asparagine 3.2 8 1 P proline 4.0 10 1 Q glutamine 2.8 7 1 R arginine 3.6 9 2 S serine 9.9 25 2 T threonine 6.7 17 1 V valine 5.1 13 1 W tryptophan 2.8 7 1 Y tyrosine 3.2 8 1 |
Comparative genomics:
Search single species RefSeq proteins at NCBI
Search summary 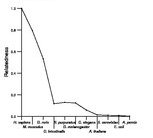
Figure data | ||
Related human proteins:Protein Relative score Description Self-match 1.000 retinal G-protein coupled receptor isoform 3 RGR 0.961 retinal G-protein coupled receptor isoform 2 RGR 0.949 retinal G-protein coupled receptor isoform 1 RRH 0.178 peropsin OPN4 0.154 opsin 4 isoform 1 OPN3 0.138 opsin 3 OPN4 0.138 opsin 4 isoform 2 OPN5 0.122 opsin 5 isoform 1 RHO 0.108 rhodopsin MTNR1A 0.071 melatonin receptor 1A HTR7 0.071 5-hydroxytryptamine receptor 7 isoform b HTR7 0.071 5-hydroxytryptamine receptor 7 isoform d HTR7 0.071 5-hydroxytryptamine receptor 7 isoform a OPN1LW 0.065 opsin 1 (cone pigments), long-wave-sensitive TRHR 0.065 thyrotropin-releasing hormone receptor OPN1MW2 0.063 opsin 1 (cone pigments), medium-wave-sensitive 2 [H... OPN1MW 0.063 opsin 1 (cone pigments), medium-wave-sensitive ADRB2 0.061 adrenergic, beta-2-, receptor, surface ADRB1 0.059 beta-1-adrenergic receptor ADRB3 0.059 adrenergic, beta-3-, receptor MTNR1B 0.057 melatonin receptor 1B TACR3 0.057 tachykinin receptor 3 GPR50 0.057 G protein-coupled receptor 50 ADRA1B 0.055 alpha-1B-adrenergic receptor OPRL1 0.055 opiate receptor-like 1 OPRL1 0.055 opiate receptor-like 1 SSTR1 0.055 somatostatin receptor 1 HRH1 0.051 histamine receptor H1 HRH1 0.051 histamine receptor H1 HRH1 0.051 histamine receptor H1Human BLASTP results (used to prepare the table) | |||
Gene descriptions are from NCBI RefSeq. Search results were obtained with NCBI BLAST and RefSeq entries. When identical proteins are present, the self-match may not be listed first in BLASTP output. In such cases, the table above has been reordered to place it first.
See About the Figures for the scoring system used in the figure above right. The same scoring system was used in the table of BLASTP results.
Guide to the Human Genome
Copyright © 2010 by Stewart Scherer. All rights reserved.
