
| Name: SF3A3 | Sequence: fasta or formatted (501aa) | NCBI GI: 5803167 | |
|
Description: splicing factor 3a, subunit 3
|
Referenced in:
| ||
|
Composition:
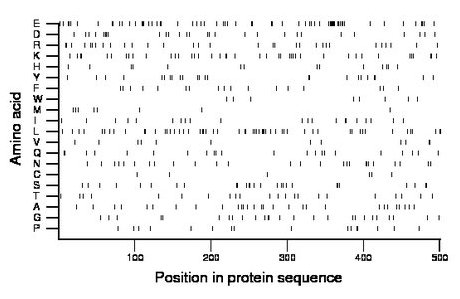
Amino acid Percentage Count Longest homopolymer A alanine 5.8 29 1 C cysteine 1.2 6 1 D aspartate 5.6 28 2 E glutamate 13.2 66 6 F phenylalanine 3.4 17 1 G glycine 5.2 26 2 H histidine 2.8 14 1 I isoleucine 4.2 21 2 K lysine 8.2 41 2 L leucine 11.2 56 2 M methionine 1.8 9 1 N asparagine 5.2 26 1 P proline 3.2 16 1 Q glutamine 4.4 22 2 R arginine 6.2 31 2 S serine 5.4 27 2 T threonine 4.4 22 1 V valine 2.4 12 2 W tryptophan 1.6 8 1 Y tyrosine 4.8 24 1 |
Comparative genomics:
Search single species RefSeq proteins at NCBI
Search summary 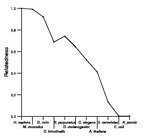
Figure data | ||
Related human proteins:Protein Relative score Description Self-match 1.000 splicing factor 3a, subunit 3 C1orf55 0.052 hypothetical protein LOC163859 WDR60 0.018 WD repeat domain 60 DCAF8L2 0.016 DDB1 and CUL4 associated factor 8-like 2 MYT1 0.014 myelin transcription factor 1 NIN 0.014 ninein isoform 4 NIN 0.014 ninein isoform 5 NIN 0.014 ninein isoform 1 NIN 0.014 ninein isoform 2 LOC728792 0.014 PREDICTED: hypothetical protein GOLGA2 0.014 Golgi autoantigen, golgin subfamily a, 2 ECM2 0.013 extracellular matrix protein 2 precursor MYST4 0.012 MYST histone acetyltransferase (monocytic leukemia)... LOC100133220 0.012 PREDICTED: hypothetical protein SLC24A1 0.012 solute carrier family 24 (sodium/potassium/calcium ex... LOC283685 0.011 PREDICTED: golgi autoantigen, golgin subfamily a-li... NRD1 0.011 nardilysin isoform b NRD1 0.011 nardilysin isoform a ATRX 0.011 transcriptional regulator ATRX isoform 2 ATRX 0.011 transcriptional regulator ATRX isoform 1 NSBP1 0.011 nucleosomal binding protein 1 PCSK2 0.011 proprotein convertase subtilisin/kexin type 2 CCDC136 0.011 coiled-coil domain containing 136 CNGB1 0.010 cyclic nucleotide gated channel beta 1 isoform a [H... SHROOM4 0.010 shroom family member 4 HOMER2 0.010 homer 2 isoform 4 CLSTN1 0.010 calsyntenin 1 isoform 1 CLSTN1 0.010 calsyntenin 1 isoform 2 CLSPN 0.010 claspin HS6ST3 0.010 PREDICTED: heparan sulfate 6-O-sulfotransferase 3 [...Human BLASTP results (used to prepare the table) | |||
Gene descriptions are from NCBI RefSeq. Search results were obtained with NCBI BLAST and RefSeq entries. When identical proteins are present, the self-match may not be listed first in BLASTP output. In such cases, the table above has been reordered to place it first.
See About the Figures for the scoring system used in the figure above right. The same scoring system was used in the table of BLASTP results.
Guide to the Human Genome
Copyright © 2010 by Stewart Scherer. All rights reserved.
