
| Name: SF3B2 | Sequence: fasta or formatted (895aa) | NCBI GI: 55749531 | |
|
Description: splicing factor 3B subunit 2
|
Referenced in:
| ||
|
Composition:
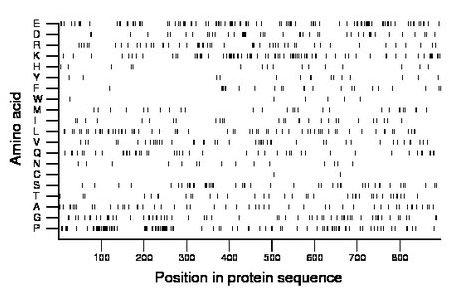
Amino acid Percentage Count Longest homopolymer A alanine 6.4 57 2 C cysteine 0.2 2 1 D aspartate 5.1 46 3 E glutamate 12.3 110 7 F phenylalanine 2.6 23 2 G glycine 6.9 62 2 H histidine 1.8 16 1 I isoleucine 3.1 28 1 K lysine 9.4 84 5 L leucine 7.4 66 2 M methionine 3.1 28 2 N asparagine 1.7 15 1 P proline 12.2 109 10 Q glutamine 5.6 50 3 R arginine 5.6 50 2 S serine 5.4 48 2 T threonine 4.1 37 1 V valine 4.8 43 2 W tryptophan 0.7 6 1 Y tyrosine 1.7 15 2 |
Comparative genomics:
Search single species RefSeq proteins at NCBI
Search summary 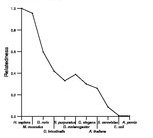
Figure data | ||
Related human proteins:Protein Relative score Description Self-match 1.000 splicing factor 3B subunit 2 PELP1 0.026 proline, glutamic acid and leucine rich protein 1 [... SETD1B 0.025 SET domain containing 1B SMARCA2 0.023 SWI/SNF-related matrix-associated actin-dependent re... SMARCA2 0.023 SWI/SNF-related matrix-associated actin-dependent re... WAS 0.023 Wiskott-Aldrich syndrome protein TTN 0.022 titin isoform N2-A FLJ22184 0.022 PREDICTED: hypothetical protein FLJ22184 DIAPH1 0.022 diaphanous 1 isoform 2 DIAPH1 0.022 diaphanous 1 isoform 1 WASL 0.022 Wiskott-Aldrich syndrome gene-like protein WASF2 0.022 WAS protein family, member 2 CBLL1 0.021 Cas-Br-M (murine) ecotropic retroviral transforming... SF1 0.021 splicing factor 1 isoform 1 PRR12 0.021 proline rich 12 SETD1A 0.021 SET domain containing 1A PRCC 0.021 papillary renal cell carcinoma translocation-associa... PRCC 0.021 papillary renal cell carcinoma translocation-associa... FMN1 0.020 formin 1 ESPN 0.020 espin TRDN 0.020 triadin RAPH1 0.019 Ras association and pleckstrin homology domains 1 is... BAT2 0.019 HLA-B associated transcript-2 EIF3A 0.019 eukaryotic translation initiation factor 3, subunit 1... NEFM 0.019 neurofilament, medium polypeptide 150kDa isoform 1 ... NEFM 0.019 neurofilament, medium polypeptide 150kDa isoform 2 ... PRPF40B 0.019 Huntingtin interacting protein C isoform 1 DIAPH2 0.019 diaphanous 2 isoform 12C DIAPH2 0.019 diaphanous 2 isoform 156 BRD4 0.018 bromodomain-containing protein 4 isoform longHuman BLASTP results (used to prepare the table) | |||
Gene descriptions are from NCBI RefSeq. Search results were obtained with NCBI BLAST and RefSeq entries. When identical proteins are present, the self-match may not be listed first in BLASTP output. In such cases, the table above has been reordered to place it first.
See About the Figures for the scoring system used in the figure above right. The same scoring system was used in the table of BLASTP results.
Guide to the Human Genome
Copyright © 2010 by Stewart Scherer. All rights reserved.
