
| Name: CA3 | Sequence: fasta or formatted (260aa) | NCBI GI: 4885099 | |
|
Description: carbonic anhydrase III
|
Referenced in:
| ||
|
Composition:
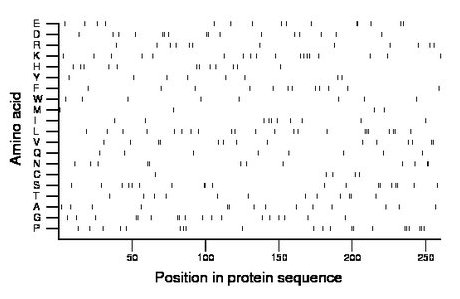
Amino acid Percentage Count Longest homopolymer A alanine 5.4 14 2 C cysteine 1.9 5 1 D aspartate 6.2 16 2 E glutamate 5.8 15 2 F phenylalanine 4.6 12 1 G glycine 6.9 18 2 H histidine 4.6 12 1 I isoleucine 3.8 10 1 K lysine 6.9 18 1 L leucine 8.5 22 3 M methionine 1.5 4 1 N asparagine 4.6 12 2 P proline 8.1 21 2 Q glutamine 3.1 8 1 R arginine 4.6 12 1 S serine 7.3 19 2 T threonine 4.6 12 2 V valine 5.4 14 2 W tryptophan 3.1 8 1 Y tyrosine 3.1 8 1 |
Comparative genomics:
Search single species RefSeq proteins at NCBI
Search summary 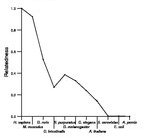
Figure data | ||
Related human proteins:Protein Relative score Description Self-match 1.000 carbonic anhydrase III CA2 0.569 carbonic anhydrase II CA13 0.549 carbonic anhydrase XIII CA1 0.519 carbonic anhydrase I CA1 0.519 carbonic anhydrase I CA1 0.519 carbonic anhydrase I CA1 0.519 carbonic anhydrase I CA7 0.493 carbonic anhydrase VII isoform 1 CA5B 0.410 carbonic anhydrase VB, mitochondrial precursor CA7 0.391 carbonic anhydrase VII isoform 2 CA5A 0.391 carbonic anhydrase VA, mitochondrial precursor CA8 0.288 carbonic anhydrase VIII CA14 0.243 carbonic anhydrase XIV precursor CA12 0.234 carbonic anhydrase XII isoform 2 precursor CA12 0.234 carbonic anhydrase XII isoform 1 precursor CA6 0.232 carbonic anhydrase VI precursor CA10 0.204 carbonic anhydrase X CA10 0.204 carbonic anhydrase X CA10 0.204 carbonic anhydrase X CA9 0.197 carbonic anhydrase IX precursor CA4 0.178 carbonic anhydrase IV precursor CA11 0.178 carbonic anhydrase XI precursor PTPRG 0.176 protein tyrosine phosphatase, receptor type, G prec... PTPRZ1 0.139 protein tyrosine phosphatase, receptor-type, zeta1 p... LOC402036 0.036 PREDICTED: similar to hCG1646661 LOC402036 0.036 PREDICTED: similar to hCG1646661 LOC402036 0.036 PREDICTED: similar to hCG1646661 LOC645390 0.032 PREDICTED: similar to hCG1646661 LOC440795 0.032 PREDICTED: similar to hCG1646661 TOM1L2 0.019 target of myb1-like 2 isoform 3Human BLASTP results (used to prepare the table) | |||
Gene descriptions are from NCBI RefSeq. Search results were obtained with NCBI BLAST and RefSeq entries. When identical proteins are present, the self-match may not be listed first in BLASTP output. In such cases, the table above has been reordered to place it first.
See About the Figures for the scoring system used in the figure above right. The same scoring system was used in the table of BLASTP results.
Guide to the Human Genome
Copyright © 2010 by Stewart Scherer. All rights reserved.
