
| Name: CRTAC1 | Sequence: fasta or formatted (661aa) | NCBI GI: 47777317 | |
|
Description: cartilage acidic protein 1
|
Referenced in:
| ||
|
Composition:
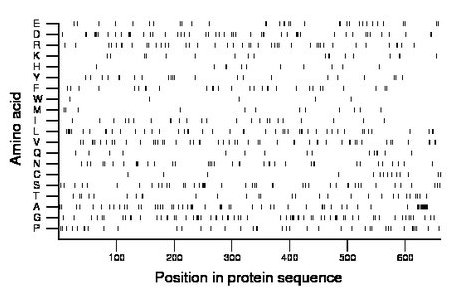
Amino acid Percentage Count Longest homopolymer A alanine 9.4 62 7 C cysteine 2.1 14 1 D aspartate 7.7 51 2 E glutamate 5.1 34 2 F phenylalanine 4.4 29 2 G glycine 10.0 66 2 H histidine 1.7 11 1 I isoleucine 3.8 25 2 K lysine 2.7 18 2 L leucine 7.1 47 4 M methionine 2.0 13 1 N asparagine 5.9 39 3 P proline 5.9 39 2 Q glutamine 2.3 15 2 R arginine 6.5 43 2 S serine 7.0 46 3 T threonine 4.5 30 2 V valine 7.9 52 2 W tryptophan 0.8 5 1 Y tyrosine 3.3 22 2 |
Comparative genomics:
Search single species RefSeq proteins at NCBI
Search summary 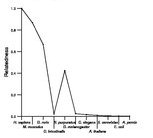
Figure data | ||
Related human proteins:Protein Relative score Description Self-match 1.000 cartilage acidic protein 1 FBLN1 0.032 fibulin 1 isoform B precursor FBLN1 0.032 fibulin 1 isoform A precursor FBLN1 0.032 fibulin 1 isoform D FBLN1 0.032 fibulin 1 isoform C precursor FBLN2 0.026 fibulin 2 isoform b precursor FBLN2 0.026 fibulin 2 isoform a precursor FBN2 0.025 fibrillin 2 precursor FBN3 0.022 fibrillin 3 precursor LTBP1 0.019 latent transforming growth factor beta binding prote... LTBP1 0.019 latent transforming growth factor beta binding prote... FBLN5 0.019 fibulin 5 precursor FBN1 0.018 fibrillin 1 precursor HMCN1 0.018 hemicentin 1 LTBP2 0.017 latent transforming growth factor beta binding protei... CRELD2 0.017 cysteine-rich with EGF-like domains 2 isoform b [Ho... CRELD2 0.017 cysteine-rich with EGF-like domains 2 isoform a [Ho... LTBP3 0.015 latent transforming growth factor beta binding prot... LTBP3 0.015 latent transforming growth factor beta binding prote... EGFL6 0.015 epidermal growth factor-like protein 6 precursor [Ho... SCUBE2 0.014 CEGP1 protein NID2 0.014 nidogen 2 precursor LRP2 0.014 low density lipoprotein-related protein 2 LTBP4 0.014 latent transforming growth factor beta binding prot... LTBP4 0.014 latent transforming growth factor beta binding prot... LTBP4 0.014 latent transforming growth factor beta binding prot... NID1 0.014 nidogen 1 precursor EFEMP1 0.014 EGF-containing fibulin-like extracellular matrix pro... EFEMP1 0.014 EGF-containing fibulin-like extracellular matrix pro... EFEMP1 0.014 EGF-containing fibulin-like extracellular matrix prot...Human BLASTP results (used to prepare the table) | |||
Gene descriptions are from NCBI RefSeq. Search results were obtained with NCBI BLAST and RefSeq entries. When identical proteins are present, the self-match may not be listed first in BLASTP output. In such cases, the table above has been reordered to place it first.
See About the Figures for the scoring system used in the figure above right. The same scoring system was used in the table of BLASTP results.
Guide to the Human Genome
Copyright © 2010 by Stewart Scherer. All rights reserved.
