
| Name: MAP1LC3B | Sequence: fasta or formatted (125aa) | NCBI GI: 12383056 | |
|
Description: microtubule-associated proteins 1A/1B light chain 3
|
Referenced in: Additional Membrane Functions
| ||
|
Composition:
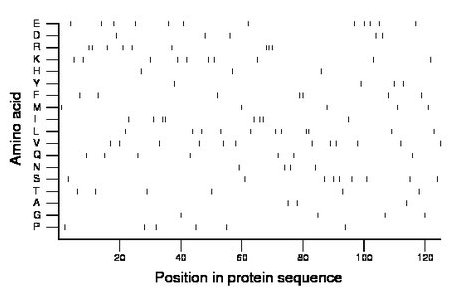
Amino acid Percentage Count Longest homopolymer A alanine 2.4 3 1 C cysteine 0.0 0 0 D aspartate 4.0 5 1 E glutamate 9.6 12 1 F phenylalanine 5.6 7 2 G glycine 3.2 4 1 H histidine 2.4 3 1 I isoleucine 6.4 8 2 K lysine 8.0 10 1 L leucine 8.8 11 2 M methionine 4.0 5 1 N asparagine 3.2 4 1 P proline 4.8 6 1 Q glutamine 5.6 7 1 R arginine 7.2 9 3 S serine 7.2 9 1 T threonine 4.8 6 1 V valine 9.6 12 1 W tryptophan 0.0 0 0 Y tyrosine 3.2 4 1 |
Comparative genomics:
Search single species RefSeq proteins at NCBI
Search summary 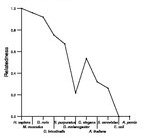
Figure data | ||
Related human proteins:Protein Relative score Description Self-match 1.000 microtubule-associated proteins 1A/1B light chain 3 ... MAP1LC3B2 0.986 microtubule-associated protein 1 light chain 3 beta... LOC392288 0.851 PREDICTED: similar to microtubule-associated protei... LOC392288 0.851 PREDICTED: similar to microtubule-associated protei... LOC392288 0.851 PREDICTED: similar to microtubule-associated protei... MAP1LC3A 0.811 microtubule-associated protein 1 light chain 3 alpha... MAP1LC3A 0.721 microtubule-associated protein 1 light chain 3 alpha... LOC652191 0.581 PREDICTED: similar to microtubule-associated protei... LOC652191 0.581 PREDICTED: similar to microtubule-associated protei... LOC652191 0.581 PREDICTED: similar to microtubule-associated protei... MAP1LC3C 0.495 microtubule-associated protein 1 light chain 3 gamma... GABARAPL2 0.302 GABA(A) receptor-associated protein-like 2 GABARAPL1 0.239 GABA(A) receptor-associated protein like 1 GABARAP 0.230 GABA(A) receptor-associated protein AMIGO1 0.023 AMIGO protein MCTP1 0.014 multiple C2 domains, transmembrane 1 isoform S [Homo... MCTP1 0.014 multiple C2 domains, transmembrane 1 isoform L [Hom... VPRBP 0.009 HIV-1 Vpr binding protein CLCN3 0.009 chloride channel 3 isoform e CLCN3 0.009 chloride channel 3 isoform b ZCCHC6 0.005 zinc finger, CCHC domain containing 6 COPE 0.005 epsilon subunit of coatomer protein complex isoform ... COPE 0.005 epsilon subunit of coatomer protein complex isoform ... COPE 0.005 epsilon subunit of coatomer protein complex isoform ... PLXND1 0.005 plexin D1Human BLASTP results (used to prepare the table) | |||
Gene descriptions are from NCBI RefSeq. Search results were obtained with NCBI BLAST and RefSeq entries. When identical proteins are present, the self-match may not be listed first in BLASTP output. In such cases, the table above has been reordered to place it first.
See About the Figures for the scoring system used in the figure above right. The same scoring system was used in the table of BLASTP results.
Guide to the Human Genome
Copyright © 2010 by Stewart Scherer. All rights reserved.
