| Name: KAAG1 | Sequence: fasta or formatted (84aa) | NCBI GI: 31044434 | |
|
Description: kidney associated antigen 1
|
Referenced in:
| ||
|
Composition:

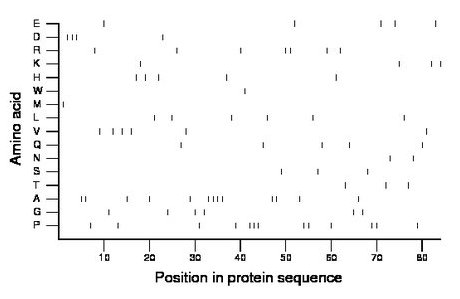
Amino acid Percentage Count Longest homopolymer A alanine 15.5 13 4 C cysteine 0.0 0 0 D aspartate 4.8 4 3 E glutamate 6.0 5 1 F phenylalanine 0.0 0 0 G glycine 7.1 6 1 H histidine 6.0 5 1 I isoleucine 0.0 0 0 K lysine 4.8 4 1 L leucine 7.1 6 1 M methionine 1.2 1 1 N asparagine 2.4 2 1 P proline 15.5 13 3 Q glutamine 6.0 5 1 R arginine 8.3 7 2 S serine 3.6 3 1 T threonine 3.6 3 1 V valine 7.1 6 1 W tryptophan 1.2 1 1 Y tyrosine 0.0 0 0 |
Comparative genomics:
Search single species RefSeq proteins at NCBI
Search summary 
Figure data | ||
Related human proteins:Protein Relative score Description Self-match 1.000 kidney associated antigen 1 CASKIN1 0.085 CASK interacting protein 1 LOC100127930 0.072 PREDICTED: hypothetical protein LOC100127930 0.072 PREDICTED: hypothetical protein LOC100127930 0.072 PREDICTED: hypothetical protein NDUFV3 0.052 NADH-ubiquinone oxidoreductase flavoprotein 3 isofor... GLCCI1 0.052 glucocorticoid induced transcript 1 C11orf35 0.039 hypothetical protein LOC256329 NACC1 0.033 transcriptional repressor NAC1 SYN1 0.033 synapsin I isoform Ia SYN1 0.033 synapsin I isoform Ib LOC100293036 0.033 PREDICTED: hypothetical protein LOC100292916 0.033 PREDICTED: hypothetical protein LOC100289065 0.033 PREDICTED: hypothetical protein LOC100290781 0.033 PREDICTED: hypothetical protein XP_002347101 LOC100289065 0.033 PREDICTED: hypothetical protein XP_002343789 LOC100289368 0.033 PREDICTED: hypothetical protein XP_002343360 LOC100286938 0.033 PREDICTED: hypothetical protein XP_002342984 PELP1 0.033 proline, glutamic acid and leucine rich protein 1 [... IP6K3 0.033 inositol hexakisphosphate kinase 3 IP6K3 0.033 inositol hexakisphosphate kinase 3 SPEG 0.033 SPEG complex locus SYNJ1 0.026 synaptojanin 1 isoform c HS3ST4 0.026 heparan sulfate D-glucosaminyl 3-O-sulfotransferase... UAP1L1 0.026 UDP-N-acteylglucosamine pyrophosphorylase 1-like 1 ... C9orf66 0.026 hypothetical protein LOC157983 LOC100292927 0.026 PREDICTED: hypothetical protein LOC100128074 0.026 PREDICTED: hypothetical protein LOC100289003 0.026 PREDICTED: hypothetical protein XP_002342618 FLJ22184 0.020 PREDICTED: hypothetical protein FLJ22184Human BLASTP results (used to prepare the table) | |||
Gene descriptions are from NCBI RefSeq. Search results were obtained with NCBI BLAST and RefSeq entries. When identical proteins are present, the self-match may not be listed first in BLASTP output. In such cases, the table above has been reordered to place it first.
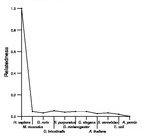
See About the Figures for the scoring system used in the figure above right. The same scoring system was used in the table of BLASTP results.
Guide to the Human Genome
Copyright © 2010 by Stewart Scherer. All rights reserved.
