
| Name: GLCCI1 | Sequence: fasta or formatted (547aa) | NCBI GI: 55742678 | |
|
Description: glucocorticoid induced transcript 1
|
Referenced in:
| ||
|
Composition:
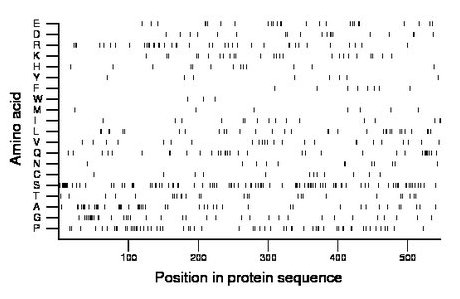
Amino acid Percentage Count Longest homopolymer A alanine 8.8 48 5 C cysteine 2.2 12 1 D aspartate 3.5 19 2 E glutamate 4.8 26 2 F phenylalanine 1.5 8 1 G glycine 6.6 36 5 H histidine 2.4 13 1 I isoleucine 2.9 16 2 K lysine 4.6 25 1 L leucine 6.0 33 2 M methionine 1.5 8 1 N asparagine 2.4 13 2 P proline 11.2 61 2 Q glutamine 6.2 34 4 R arginine 7.1 39 2 S serine 17.4 95 9 T threonine 4.8 26 1 V valine 4.4 24 1 W tryptophan 0.5 3 1 Y tyrosine 1.5 8 1 |
Comparative genomics:
Search single species RefSeq proteins at NCBI
Search summary 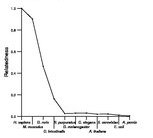
Figure data | ||
Related human proteins:Protein Relative score Description Self-match 1.000 glucocorticoid induced transcript 1 FAM117B 0.285 amyotrophic lateral sclerosis 2 (juvenile) chromosom... FAM117A 0.217 family with sequence similarity 117, member A RANBP9 0.031 RAN binding protein 9 SRRM1 0.028 serine/arginine repetitive matrix 1 SRRM2 0.027 splicing coactivator subunit SRm300 LOC100293375 0.025 PREDICTED: hypothetical protein LOC100130360 0.023 PREDICTED: hypothetical protein TTN 0.023 titin isoform novex-3 TTN 0.023 titin isoform N2-A TTN 0.023 titin isoform novex-2 TTN 0.023 titin isoform novex-1 TTN 0.023 titin isoform N2-B ARHGAP17 0.023 nadrin isoform 1 BSN 0.022 bassoon protein GLTSCR1 0.022 glioma tumor suppressor candidate region gene 1 [Ho... UNCX 0.022 UNC homeobox PAWR 0.022 PRKC, apoptosis, WT1, regulator ARID1B 0.022 AT rich interactive domain 1B (SWI1-like) isoform 2 ... ARID1B 0.022 AT rich interactive domain 1B (SWI1-like) isoform 1 ... ARID1B 0.022 AT rich interactive domain 1B (SWI1-like) isoform 3 ... SMARCA4 0.021 SWI/SNF-related matrix-associated actin-dependent r... SMARCA4 0.021 SWI/SNF-related matrix-associated actin-dependent r... SMARCA4 0.021 SWI/SNF-related matrix-associated actin-dependent r... SMARCA4 0.021 SWI/SNF-related matrix-associated actin-dependent r... SMARCA4 0.021 SWI/SNF-related matrix-associated actin-dependent r... SMARCA4 0.021 SWI/SNF-related matrix-associated actin-dependent r... SMARCA4 0.021 SWI/SNF-related matrix-associated actin-dependent re... TAF4 0.021 TBP-associated factor 4 TRIO 0.021 triple functional domain (PTPRF interacting)Human BLASTP results (used to prepare the table) | |||
Gene descriptions are from NCBI RefSeq. Search results were obtained with NCBI BLAST and RefSeq entries. When identical proteins are present, the self-match may not be listed first in BLASTP output. In such cases, the table above has been reordered to place it first.
See About the Figures for the scoring system used in the figure above right. The same scoring system was used in the table of BLASTP results.
Guide to the Human Genome
Copyright © 2010 by Stewart Scherer. All rights reserved.
