
| Name: PRIMA1 | Sequence: fasta or formatted (153aa) | NCBI GI: 29788778 | |
|
Description: proline rich membrane anchor 1 precursor
|
Referenced in:
| ||
|
Composition:
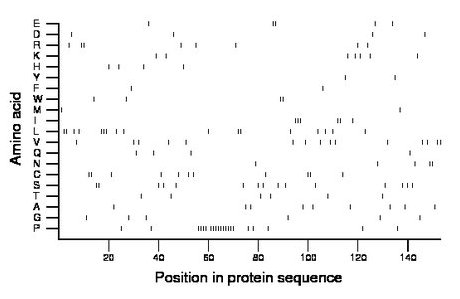
Amino acid Percentage Count Longest homopolymer A alanine 5.9 9 1 C cysteine 7.2 11 2 D aspartate 2.6 4 1 E glutamate 3.3 5 2 F phenylalanine 1.3 2 1 G glycine 3.9 6 1 H histidine 2.6 4 1 I isoleucine 3.9 6 3 K lysine 4.6 7 1 L leucine 11.1 17 3 M methionine 1.3 2 1 N asparagine 3.3 5 2 P proline 13.7 21 10 Q glutamine 2.6 4 1 R arginine 5.2 8 2 S serine 9.8 15 2 T threonine 3.9 6 1 V valine 9.8 15 2 W tryptophan 2.6 4 2 Y tyrosine 1.3 2 1 |
Comparative genomics:
Search single species RefSeq proteins at NCBI
Search summary 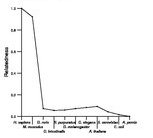
Figure data | ||
Related human proteins:Protein Relative score Description Self-match 1.000 proline rich membrane anchor 1 precursor RAPH1 0.072 Ras association and pleckstrin homology domains 1 is... FMNL2 0.072 formin-like 2 MYPOP 0.072 Myb protein P42POP KDM6B 0.072 lysine (K)-specific demethylase 6B PCLO 0.069 piccolo isoform 2 PCLO 0.069 piccolo isoform 1 FHOD1 0.069 formin homology 2 domain containing 1 FMN1 0.069 formin 1 TRERF1 0.066 transcriptional regulating factor 1 ZNF827 0.066 zinc finger protein 827 ZNF318 0.062 zinc finger protein 318 ZFHX4 0.062 zinc finger homeodomain 4 HOXB4 0.062 homeobox B4 WHAMM 0.062 WAS protein homolog associated with actin, golgi me... ZFHX3 0.059 AT-binding transcription factor 1 EVL 0.059 Enah/Vasp-like FASLG 0.059 fas ligand ASXL3 0.056 additional sex combs like 3 BAT3 0.056 HLA-B associated transcript-3 isoform b BAT3 0.056 HLA-B associated transcript-3 isoform b BAT3 0.056 HLA-B associated transcript-3 isoform b BAT3 0.056 HLA-B associated transcript-3 isoform a HOXA10 0.056 homeobox A10 isoform a RANBP9 0.056 RAN binding protein 9 BAI1 0.056 brain-specific angiogenesis inhibitor 1 precursor [... CHD3 0.056 chromodomain helicase DNA binding protein 3 isoform... WIPF3 0.056 WAS/WASL interacting protein family, member 3 [Homo... SETD1B 0.056 SET domain containing 1B ZNF341 0.056 zinc finger protein 341Human BLASTP results (used to prepare the table) | |||
Gene descriptions are from NCBI RefSeq. Search results were obtained with NCBI BLAST and RefSeq entries. When identical proteins are present, the self-match may not be listed first in BLASTP output. In such cases, the table above has been reordered to place it first.
See About the Figures for the scoring system used in the figure above right. The same scoring system was used in the table of BLASTP results.
Guide to the Human Genome
Copyright © 2010 by Stewart Scherer. All rights reserved.
