
| Name: GAS2L3 | Sequence: fasta or formatted (694aa) | NCBI GI: 28372563 | |
|
Description: growth arrest-specific 2 like 3
|
Referenced in: Additional Cell Cycle Functions
| ||
|
Composition:
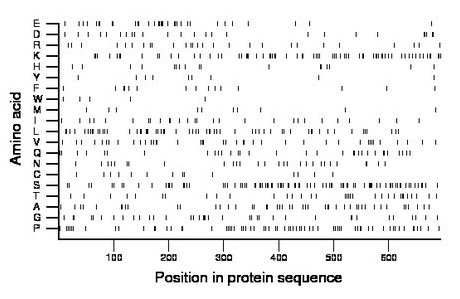
Amino acid Percentage Count Longest homopolymer A alanine 6.6 46 2 C cysteine 2.2 15 2 D aspartate 3.7 26 3 E glutamate 4.8 33 2 F phenylalanine 2.2 15 2 G glycine 5.5 38 3 H histidine 2.4 17 1 I isoleucine 4.0 28 1 K lysine 10.2 71 3 L leucine 8.9 62 2 M methionine 1.6 11 1 N asparagine 4.2 29 2 P proline 9.9 69 2 Q glutamine 4.6 32 1 R arginine 3.9 27 1 S serine 12.7 88 3 T threonine 4.8 33 1 V valine 5.8 40 1 W tryptophan 0.7 5 1 Y tyrosine 1.3 9 1 |
Comparative genomics:
Search single species RefSeq proteins at NCBI
Search summary 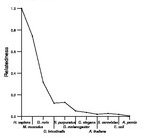
Figure data | ||
Related human proteins:Protein Relative score Description Self-match 1.000 growth arrest-specific 2 like 3 GAS2 0.231 growth arrest-specific 2 GAS2 0.231 growth arrest-specific 2 GAS2 0.231 growth arrest-specific 2 GAS2L2 0.115 growth arrest-specific 2 like 2 GAS2L1 0.103 growth arrest-specific 2 like 1 isoform a GAS2L1 0.103 growth arrest-specific 2 like 1 isoform a GAS2L1 0.094 growth arrest-specific 2 like 1 isoform b SRRM2 0.036 splicing coactivator subunit SRm300 MACF1 0.035 microfilament and actin filament cross-linker protei... MACF1 0.031 microfilament and actin filament cross-linker protei... NACA 0.027 nascent polypeptide-associated complex alpha subuni... MUC17 0.026 mucin 17 MDC1 0.025 mediator of DNA-damage checkpoint 1 PRG4 0.024 proteoglycan 4 isoform D PRG4 0.024 proteoglycan 4 isoform C PRG4 0.024 proteoglycan 4 isoform B PRG4 0.024 proteoglycan 4 isoform A LOC100133756 0.024 PREDICTED: hypothetical protein, partial NEFH 0.023 neurofilament, heavy polypeptide 200kDa TXNDC2 0.023 thioredoxin domain-containing 2 isoform 1 TXNDC2 0.023 thioredoxin domain-containing 2 isoform 2 TXNDC2 0.023 thioredoxin domain-containing 2 isoform 1 DST 0.022 dystonin isoform 4 DST 0.022 dystonin isoform 3 DST 0.022 dystonin isoform 2 DST 0.022 dystonin isoform 1 DST 0.022 dystonin isoform 1eA precursor MAP4 0.022 microtubule-associated protein 4 isoform 4 MAP4 0.022 microtubule-associated protein 4 isoform 2Human BLASTP results (used to prepare the table) | |||
Gene descriptions are from NCBI RefSeq. Search results were obtained with NCBI BLAST and RefSeq entries. When identical proteins are present, the self-match may not be listed first in BLASTP output. In such cases, the table above has been reordered to place it first.
See About the Figures for the scoring system used in the figure above right. The same scoring system was used in the table of BLASTP results.
Guide to the Human Genome
Copyright © 2010 by Stewart Scherer. All rights reserved.
