
| Name: FBL | Sequence: fasta or formatted (321aa) | NCBI GI: 12056465 | |
|
Description: fibrillarin
|
Referenced in:
| ||
|
Composition:
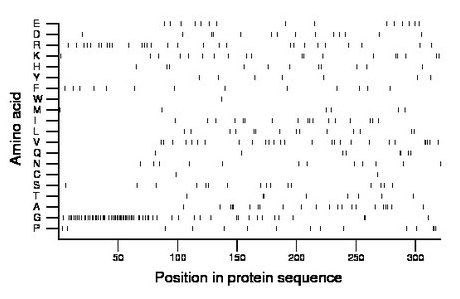
Amino acid Percentage Count Longest homopolymer A alanine 6.9 22 3 C cysteine 0.6 2 1 D aspartate 4.4 14 2 E glutamate 4.7 15 1 F phenylalanine 4.0 13 1 G glycine 20.2 65 13 H histidine 3.4 11 1 I isoleucine 5.3 17 2 K lysine 5.9 19 2 L leucine 4.4 14 1 M methionine 1.9 6 1 N asparagine 3.7 12 1 P proline 4.7 15 3 Q glutamine 2.5 8 2 R arginine 9.0 29 1 S serine 5.0 16 1 T threonine 2.5 8 2 V valine 8.4 27 3 W tryptophan 0.3 1 1 Y tyrosine 2.2 7 1 |
Comparative genomics:
Search single species RefSeq proteins at NCBI
Search summary 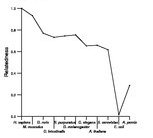
Figure data | ||
Related human proteins:Protein Relative score Description Self-match 1.000 fibrillarin FAM98B 0.109 family with sequence similarity 98, member B isofor... TAF15 0.098 TBP-associated factor 15 isoform 2 TAF15 0.098 TBP-associated factor 15 isoform 1 KRT9 0.087 keratin 9 HNRNPA1 0.087 heterogeneous nuclear ribonucleoprotein A1 isoform b... KRT3 0.083 keratin 3 KRT1 0.082 keratin 1 NCL 0.080 nucleolin HNRNPA3 0.080 heterogeneous nuclear ribonucleoprotein A3 FUS 0.080 fusion (involved in t(12;16) in malignant liposarcoma... LOR 0.076 loricrin KRT10 0.074 keratin 10 HNRNPA2B1 0.074 heterogeneous nuclear ribonucleoprotein A2/B1 isofor... HNRNPA2B1 0.074 heterogeneous nuclear ribonucleoprotein A2/B1 isoform... KRT2 0.074 keratin 2 GAR1 0.072 nucleolar protein family A, member 1 GAR1 0.072 nucleolar protein family A, member 1 EWSR1 0.069 Ewing sarcoma breakpoint region 1 isoform 4 EWSR1 0.069 Ewing sarcoma breakpoint region 1 isoform 3 EWSR1 0.069 Ewing sarcoma breakpoint region 1 isoform 1 EWSR1 0.069 Ewing sarcoma breakpoint region 1 isoform 2 FAM98A 0.069 hypothetical protein LOC25940 POU4F1 0.066 POU domain, class 4, transcription factor 1 KRT77 0.066 keratin 77 HNRNPA1 0.066 heterogeneous nuclear ribonucleoprotein A1 isoform a ... KRT76 0.065 keratin 76 CAPNS1 0.065 calpain, small subunit 1 CAPNS1 0.065 calpain, small subunit 1 HNRNPA0 0.065 heterogeneous nuclear ribonucleoprotein A0Human BLASTP results (used to prepare the table) | |||
Gene descriptions are from NCBI RefSeq. Search results were obtained with NCBI BLAST and RefSeq entries. When identical proteins are present, the self-match may not be listed first in BLASTP output. In such cases, the table above has been reordered to place it first.
See About the Figures for the scoring system used in the figure above right. The same scoring system was used in the table of BLASTP results.
Guide to the Human Genome
Copyright © 2010 by Stewart Scherer. All rights reserved.
