
| Name: LENG8 | Sequence: fasta or formatted (800aa) | NCBI GI: 24308382 | |
|
Description: leukocyte receptor cluster member 8
| Not currently referenced in the text | ||
|
Composition:
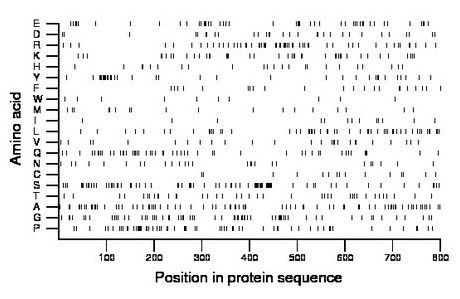
Amino acid Percentage Count Longest homopolymer A alanine 10.0 80 2 C cysteine 1.9 15 1 D aspartate 3.9 31 2 E glutamate 5.8 46 2 F phenylalanine 2.8 22 2 G glycine 8.4 67 3 H histidine 2.9 23 1 I isoleucine 1.6 13 1 K lysine 5.4 43 3 L leucine 6.5 52 2 M methionine 2.4 19 1 N asparagine 3.2 26 1 P proline 7.9 63 3 Q glutamine 6.8 54 4 R arginine 7.0 56 2 S serine 9.9 79 5 T threonine 5.0 40 2 V valine 3.2 26 1 W tryptophan 1.2 10 1 Y tyrosine 4.4 35 3 |
Comparative genomics:
Search single species RefSeq proteins at NCBI
Search summary 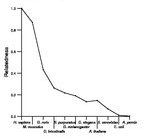
Figure data | ||
Related human proteins:Protein Relative score Description Self-match 1.000 leukocyte receptor cluster member 8 ARID1A 0.023 AT rich interactive domain 1A isoform a ARID1A 0.023 AT rich interactive domain 1A isoform b SRRM2 0.021 splicing coactivator subunit SRm300 YLPM1 0.021 YLP motif containing 1 EWSR1 0.017 Ewing sarcoma breakpoint region 1 isoform 4 HRNR 0.017 hornerin MCM3AP 0.016 minichromosome maintenance complex component 3 assoc... EWSR1 0.015 Ewing sarcoma breakpoint region 1 isoform 2 PNN 0.014 pinin, desmosome associated protein TSC22D1 0.014 TSC22 domain family, member 1 isoform 1 FLJ37078 0.014 hypothetical protein LOC222183 EWSR1 0.014 Ewing sarcoma breakpoint region 1 isoform 3 EWSR1 0.014 Ewing sarcoma breakpoint region 1 isoform 1 WDR33 0.014 WD repeat domain 33 isoform 1 SPEN 0.014 spen homolog, transcriptional regulator TFG 0.014 TRK-fused ARID1B 0.014 AT rich interactive domain 1B (SWI1-like) isoform 2 ... TFG 0.014 TRK-fused ARID1B 0.014 AT rich interactive domain 1B (SWI1-like) isoform 1 ... ARID1B 0.014 AT rich interactive domain 1B (SWI1-like) isoform 3 ... PRB1 0.014 proline-rich protein BstNI subfamily 1 isoform 1 pre... ATN1 0.014 atrophin-1 ATN1 0.014 atrophin-1 PRB2 0.014 proline-rich protein BstNI subfamily 2 TNRC18 0.013 trinucleotide repeat containing 18 SFRS16 0.013 splicing factor, arginine/serine-rich 16 FLG2 0.012 filaggrin family member 2 FOXJ2 0.012 forkhead box J2 CCNK 0.012 cyclin K isoform 1Human BLASTP results (used to prepare the table) | |||
Gene descriptions are from NCBI RefSeq. Search results were obtained with NCBI BLAST and RefSeq entries. When identical proteins are present, the self-match may not be listed first in BLASTP output. In such cases, the table above has been reordered to place it first.
See About the Figures for the scoring system used in the figure above right. The same scoring system was used in the table of BLASTP results.
Guide to the Human Genome
Copyright © 2010 by Stewart Scherer. All rights reserved.
