
| Name: LOC100293888 | Sequence: fasta or formatted (289aa) | NCBI GI: 239755734 | |
|
Description: PREDICTED: similar to Nanog homeobox isoform 2
|
Referenced in:
| ||
Other entries for this name:
alt prot [305aa] PREDICTED: similar to Nanog homeobox isoform 1 | |||
|
Composition:
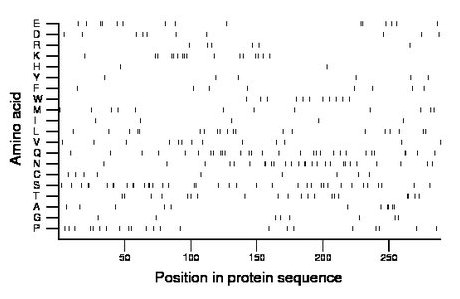
Amino acid Percentage Count Longest homopolymer A alanine 3.8 11 2 C cysteine 3.1 9 1 D aspartate 3.5 10 1 E glutamate 5.2 15 2 F phenylalanine 2.8 8 1 G glycine 2.8 8 1 H histidine 0.7 2 1 I isoleucine 1.7 5 1 K lysine 5.5 16 2 L leucine 6.9 20 2 M methionine 4.2 12 1 N asparagine 9.3 27 2 P proline 7.6 22 1 Q glutamine 10.4 30 2 R arginine 2.1 6 1 S serine 13.1 38 2 T threonine 6.9 20 2 V valine 4.5 13 1 W tryptophan 3.8 11 1 Y tyrosine 2.1 6 1 |
Comparative genomics:
Search single species RefSeq proteins at NCBI
Search summary 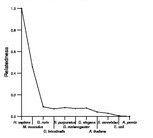
Figure data | ||
Related human proteins:Protein Relative score Description Self-match 1.000 PREDICTED: similar to Nanog homeobox isoform 2 [Hom... LOC100293888 0.981 PREDICTED: similar to Nanog homeobox isoform 1 [Hom... NANOG 0.978 Nanog homeobox BARHL1 0.077 BarH-like homeobox 1 DLX5 0.077 distal-less homeobox 5 HOXA3 0.075 homeobox A3 isoform a HOXA3 0.075 homeobox A3 isoform a DLX3 0.073 distal-less homeobox 3 TLX3 0.072 T-cell leukemia homeobox 3 HOXB2 0.072 homeobox B2 BSX 0.070 brain specific homeobox DLX2 0.070 distal-less homeobox 2 HOXA3 0.068 homeobox A3 isoform b DLX1 0.068 distal-less homeobox 1 isoform 1 TLX1 0.068 T-cell leukemia homeobox 1 NKX2-2 0.067 NK2 transcription factor related, locus 2 BARHL2 0.067 BarH-like homeobox 2 DLX4 0.067 distal-less homeobox 4 isoform b NKX2-8 0.067 NK2 homeobox 8 HOXB5 0.067 homeobox B5 DLX4 0.067 distal-less homeobox 4 isoform a BARX2 0.067 BarH-like homeobox 2 DLX6 0.063 distal-less homeobox 6 HOXD3 0.063 homeobox D3 NKX2-1 0.063 thyroid transcription factor 1 isoform 1 NKX2-1 0.063 thyroid transcription factor 1 isoform 2 NKX2-3 0.063 NK2 transcription factor related, locus 3 NKX2-5 0.061 NK2 transcription factor related, locus 5 BARX1 0.061 BarH-like homeobox 1 HMX3 0.061 H6 family homeobox 3Human BLASTP results (used to prepare the table) | |||
Gene descriptions are from NCBI RefSeq. Search results were obtained with NCBI BLAST and RefSeq entries. When identical proteins are present, the self-match may not be listed first in BLASTP output. In such cases, the table above has been reordered to place it first.
See About the Figures for the scoring system used in the figure above right. The same scoring system was used in the table of BLASTP results.
Guide to the Human Genome
Copyright © 2010 by Stewart Scherer. All rights reserved.
