
| Name: NKX2-1 | Sequence: fasta or formatted (371aa) | NCBI GI: 4507715 | |
|
Description: thyroid transcription factor 1 isoform 2
|
Referenced in: Homeobox and Related Proteins
| ||
Other entries for this name:
alt prot [401aa] thyroid transcription factor 1 isoform 1 | |||
|
Composition:
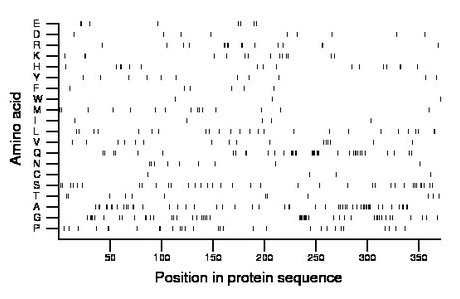
Amino acid Percentage Count Longest homopolymer A alanine 13.7 51 5 C cysteine 1.1 4 1 D aspartate 2.4 9 1 E glutamate 2.2 8 2 F phenylalanine 1.6 6 1 G glycine 12.9 48 8 H histidine 4.3 16 2 I isoleucine 1.3 5 1 K lysine 3.8 14 2 L leucine 6.7 25 2 M methionine 4.0 15 1 N asparagine 2.4 9 1 P proline 7.8 29 2 Q glutamine 10.2 38 4 R arginine 4.3 16 2 S serine 9.7 36 2 T threonine 3.2 12 2 V valine 4.3 16 1 W tryptophan 0.8 3 1 Y tyrosine 3.0 11 1 |
Comparative genomics:
Search single species RefSeq proteins at NCBI
Search summary 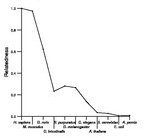
Figure data | ||
Related human proteins:Protein Relative score Description Self-match 1.000 thyroid transcription factor 1 isoform 2 NKX2-1 1.000 thyroid transcription factor 1 isoform 1 NKX2-4 0.453 NK2 homeobox 4 NKX2-3 0.162 NK2 transcription factor related, locus 3 NKX2-2 0.153 NK2 transcription factor related, locus 2 NKX2-6 0.149 NK2 transcription factor related, locus 6 NKX2-5 0.143 NK2 transcription factor related, locus 5 NKX2-8 0.139 NK2 homeobox 8 NKX3-2 0.090 NK3 homeobox 2 NKX3-1 0.083 NK3 homeobox 1 MNX1 0.080 homeo box HB9 PHOX2B 0.072 paired-like homeobox 2b HLX 0.071 H2.0-like homeobox LBX1 0.071 ladybird homeobox 1 TLX2 0.071 T-cell leukemia homeobox 2 NKX1-2 0.068 NK1 homeobox 2 NKX1-2 0.068 PREDICTED: NK1 homeobox 2 NKX1-2 0.068 PREDICTED: NK1 homeobox 2 NKX1-2 0.068 PREDICTED: NK1 homeobox 2 HMX1 0.068 homeo box (H6 family) 1 HMX3 0.068 H6 family homeobox 3 HOXB3 0.067 homeobox B3 NKX1-1 0.067 PREDICTED: NK1 homeobox 1 NKX1-1 0.067 PREDICTED: NK1 homeobox 1 NKX1-1 0.067 PREDICTED: HPX-153 homeobox BSX 0.065 brain specific homeobox HMX2 0.064 H6 family homeobox 2 PDX1 0.063 pancreatic and duodenal homeobox 1 DLX1 0.063 distal-less homeobox 1 isoform 1 HOXD3 0.061 homeobox D3Human BLASTP results (used to prepare the table) | |||
Gene descriptions are from NCBI RefSeq. Search results were obtained with NCBI BLAST and RefSeq entries. When identical proteins are present, the self-match may not be listed first in BLASTP output. In such cases, the table above has been reordered to place it first.
See About the Figures for the scoring system used in the figure above right. The same scoring system was used in the table of BLASTP results.
Guide to the Human Genome
Copyright © 2010 by Stewart Scherer. All rights reserved.
