
| Name: LOC100293485 | Sequence: fasta or formatted (1344aa) | NCBI GI: 239753480 | |
|
Description: PREDICTED: hypothetical protein
| Not currently referenced in the text | ||
|
Composition:
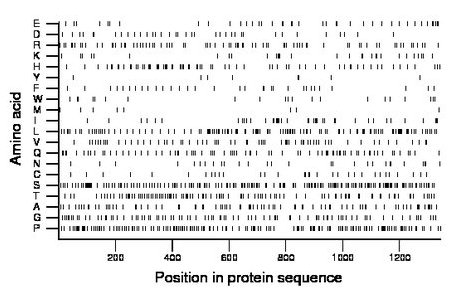
Amino acid Percentage Count Longest homopolymer A alanine 6.4 86 2 C cysteine 2.5 33 2 D aspartate 2.8 37 2 E glutamate 3.1 42 2 F phenylalanine 2.5 33 1 G glycine 6.5 87 2 H histidine 5.7 76 2 I isoleucine 3.1 42 2 K lysine 2.3 31 2 L leucine 9.7 131 3 M methionine 0.7 9 1 N asparagine 2.2 29 1 P proline 12.4 167 3 Q glutamine 5.9 79 2 R arginine 5.7 77 2 S serine 14.1 190 4 T threonine 7.6 102 3 V valine 4.8 64 1 W tryptophan 1.6 21 1 Y tyrosine 0.6 8 1 |
Comparative genomics:
Search single species RefSeq proteins at NCBI
Search summary 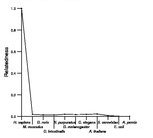
Figure data | ||
Related human proteins:Protein Relative score Description Self-match 1.000 PREDICTED: hypothetical protein LOC100289268 0.178 PREDICTED: hypothetical protein XP_002342358 LOC727978 0.107 PREDICTED: hypothetical protein LOC727978 0.096 PREDICTED: hypothetical protein, partial LOC100292957 0.053 PREDICTED: hypothetical protein LOC100290383 0.049 PREDICTED: hypothetical protein XP_002347044 GLTSCR1 0.014 glioma tumor suppressor candidate region gene 1 [Ho... MUC2 0.014 mucin 2 precursor FLJ22184 0.014 PREDICTED: hypothetical protein FLJ22184 FLJ22184 0.013 PREDICTED: hypothetical protein FLJ22184 MUC6 0.013 mucin 6, gastric MUC4 0.013 mucin 4 isoform a MUC5B 0.013 mucin 5, subtype B, tracheobronchial MUC12 0.013 PREDICTED: mucin 12 MAP1A 0.012 microtubule-associated protein 1A LOC100134138 0.011 PREDICTED: similar to mucin, partial MUC3B 0.011 PREDICTED: mucin 3B, cell surface associated, parti... MUC3A 0.011 PREDICTED: mucin 3A, intestinal LOC100133408 0.011 PREDICTED: similar to mucin MUC3A 0.011 PREDICTED: mucin 3A, cell surface associated, parti... MUC5AC 0.010 mucin 5AC HRG 0.009 histidine-rich glycoprotein precursor LOC100130716 0.009 PREDICTED: similar to mucin 11 MUC12 0.009 PREDICTED: mucin 12, cell surface associated LOC100128719 0.009 PREDICTED: hypothetical protein, partial LOC100128719 0.009 PREDICTED: hypothetical protein, partial MUC17 0.009 mucin 17 FLJ22184 0.009 PREDICTED: hypothetical protein LOC80164 MED1 0.009 mediator complex subunit 1 C2orf16 0.008 hypothetical protein LOC84226Human BLASTP results (used to prepare the table) | |||
Gene descriptions are from NCBI RefSeq. Search results were obtained with NCBI BLAST and RefSeq entries. When identical proteins are present, the self-match may not be listed first in BLASTP output. In such cases, the table above has been reordered to place it first.
See About the Figures for the scoring system used in the figure above right. The same scoring system was used in the table of BLASTP results.
Guide to the Human Genome
Copyright © 2010 by Stewart Scherer. All rights reserved.
