
| Name: TMEM92 | Sequence: fasta or formatted (159aa) | NCBI GI: 23397498 | |
|
Description: transmembrane protein 92
| Not currently referenced in the text | ||
|
Composition:
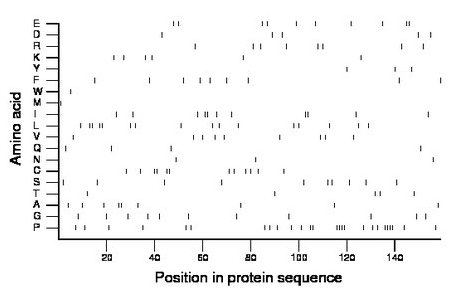
Amino acid Percentage Count Longest homopolymer A alanine 5.7 9 2 C cysteine 7.5 12 2 D aspartate 3.1 5 1 E glutamate 6.3 10 2 F phenylalanine 5.7 9 1 G glycine 6.9 11 1 H histidine 0.0 0 0 I isoleucine 6.9 11 2 K lysine 3.8 6 1 L leucine 10.1 16 2 M methionine 0.6 1 1 N asparagine 1.9 3 1 P proline 16.4 26 4 Q glutamine 2.5 4 1 R arginine 5.0 8 1 S serine 6.3 10 1 T threonine 3.1 5 1 V valine 5.7 9 1 W tryptophan 0.6 1 1 Y tyrosine 1.9 3 1 |
Comparative genomics:
Search single species RefSeq proteins at NCBI
Search summary 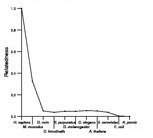
Figure data | ||
Related human proteins:Protein Relative score Description Self-match 1.000 transmembrane protein 92 USP51 0.044 ubiquitin specific protease 51 SPEG 0.038 SPEG complex locus TTN 0.035 titin isoform N2-A SHISA5 0.035 scotin FLJ22184 0.031 PREDICTED: hypothetical protein FLJ22184 FLJ22184 0.031 PREDICTED: hypothetical protein FLJ22184 FLJ22184 0.031 PREDICTED: hypothetical protein LOC80164 YLPM1 0.031 YLP motif containing 1 FMNL3 0.031 formin-like 3 isoform 2 FMNL3 0.031 formin-like 3 isoform 1 FMN1 0.028 formin 1 CSPP1 0.028 centrosome spindle pole associated protein 1 isofor... JSRP1 0.028 junctional sarcoplasmic reticulum protein 1 CSPP1 0.028 centrosome spindle pole associated protein 1 isofor... C4orf48 0.028 hypothetical protein LOC401115 WIPF1 0.028 WAS/WASL interacting protein family, member 1 [Homo... WIPF1 0.028 WAS/WASL interacting protein family, member 1 MLL2 0.028 myeloid/lymphoid or mixed-lineage leukemia 2 PRR12 0.028 proline rich 12 RAX 0.025 retina and anterior neural fold homeobox WIPF3 0.025 WAS/WASL interacting protein family, member 3 [Homo... ZIC5 0.025 zinc finger protein of the cerebellum 5 SMR3B 0.025 submaxillary gland androgen regulated protein 3 homol... NCOR2 0.025 nuclear receptor co-repressor 2 isoform 2 ABI2 0.025 abl interactor 2 MAGEE1 0.025 melanoma antigen family E, 1 ZFHX4 0.025 zinc finger homeodomain 4 WASL 0.022 Wiskott-Aldrich syndrome gene-like protein ABL2 0.022 arg tyrosine kinase isoform cHuman BLASTP results (used to prepare the table) | |||
Gene descriptions are from NCBI RefSeq. Search results were obtained with NCBI BLAST and RefSeq entries. When identical proteins are present, the self-match may not be listed first in BLASTP output. In such cases, the table above has been reordered to place it first.
See About the Figures for the scoring system used in the figure above right. The same scoring system was used in the table of BLASTP results.
Guide to the Human Genome
Copyright © 2010 by Stewart Scherer. All rights reserved.
