
| Name: TMC1 | Sequence: fasta or formatted (760aa) | NCBI GI: 21071070 | |
|
Description: transmembrane channel-like 1
|
Referenced in: Auditory and Vestibular Functions
| ||
|
Composition:
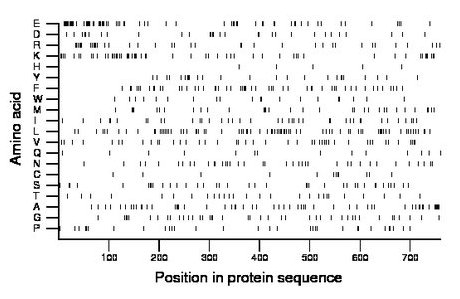
Amino acid Percentage Count Longest homopolymer A alanine 7.5 57 5 C cysteine 1.7 13 2 D aspartate 3.9 30 2 E glutamate 8.9 68 5 F phenylalanine 7.0 53 2 G glycine 5.7 43 3 H histidine 0.7 5 1 I isoleucine 5.3 40 2 K lysine 7.5 57 3 L leucine 10.4 79 3 M methionine 4.3 33 3 N asparagine 5.3 40 2 P proline 4.2 32 2 Q glutamine 2.0 15 2 R arginine 5.0 38 4 S serine 5.1 39 3 T threonine 3.7 28 2 V valine 5.8 44 2 W tryptophan 2.6 20 2 Y tyrosine 3.4 26 2 |
Comparative genomics:
Search single species RefSeq proteins at NCBI
Search summary 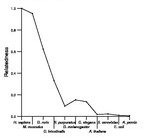
Figure data | ||
Related human proteins:Protein Relative score Description Self-match 1.000 transmembrane channel-like 1 TMC2 0.570 transmembrane cochlear-expressed protein 2 TMC3 0.362 transmembrane channel-like 3 TMC7 0.134 transmembrane channel-like 7 isoform b TMC7 0.134 transmembrane channel-like 7 isoform a TMC4 0.099 transmembrane channel-like 4 isoform 2 TMC4 0.099 transmembrane channel-like 4 isoform 1 TMC8 0.083 transmembrane channel-like 8 TMC5 0.074 transmembrane channel-like 5 isoform a TMC5 0.074 transmembrane channel-like 5 isoform c TMC6 0.072 transmembrane channel-like 6 TMC6 0.072 transmembrane channel-like 6 TMC5 0.062 transmembrane channel-like 5 isoform b LOC100294088 0.026 PREDICTED: hypothetical protein, partial WDR87 0.022 NYD-SP11 protein LOC100133599 0.019 PREDICTED: hypothetical protein LOC645202 0.019 PREDICTED: hypothetical protein LOC645202 LOC440243 0.018 PREDICTED: Putative golgin subfamily A member 6-lik... CALD1 0.018 caldesmon 1 isoform 1 TCHH 0.018 trichohyalin CALD1 0.018 caldesmon 1 isoform 5 CALD1 0.018 caldesmon 1 isoform 4 CALD1 0.018 caldesmon 1 isoform 3 CALD1 0.018 caldesmon 1 isoform 2 LOC400352 0.018 PREDICTED: similar to Putative golgin subfamily A m... LOC100132816 0.018 PREDICTED: similar to Putative golgin subfamily A m... LOC727832 0.017 golgi autoantigen, golgin subfamily a-like BAT2D1 0.016 HBxAg transactivated protein 2 RBM25 0.016 RNA binding motif protein 25 MAP1B 0.016 microtubule-associated protein 1BHuman BLASTP results (used to prepare the table) | |||
Gene descriptions are from NCBI RefSeq. Search results were obtained with NCBI BLAST and RefSeq entries. When identical proteins are present, the self-match may not be listed first in BLASTP output. In such cases, the table above has been reordered to place it first.
See About the Figures for the scoring system used in the figure above right. The same scoring system was used in the table of BLASTP results.
Guide to the Human Genome
Copyright © 2010 by Stewart Scherer. All rights reserved.
