
| Name: LOC729627 | Sequence: fasta or formatted (266aa) | NCBI GI: 197927236 | |
|
Description: hypothetical protein LOC729627
| Not currently referenced in the text | ||
|
Composition:
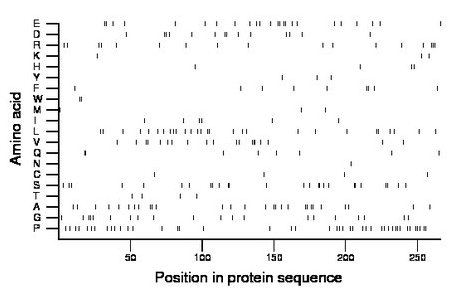
Amino acid Percentage Count Longest homopolymer A alanine 10.5 28 2 C cysteine 1.5 4 1 D aspartate 5.3 14 2 E glutamate 9.0 24 2 F phenylalanine 3.4 9 2 G glycine 7.5 20 2 H histidine 1.5 4 1 I isoleucine 2.3 6 1 K lysine 1.1 3 1 L leucine 10.5 28 2 M methionine 1.1 3 1 N asparagine 0.4 1 1 P proline 16.2 43 2 Q glutamine 3.0 8 2 R arginine 6.4 17 3 S serine 9.8 26 2 T threonine 1.5 4 1 V valine 7.1 19 3 W tryptophan 0.8 2 2 Y tyrosine 1.1 3 1 |
Comparative genomics:
Search single species RefSeq proteins at NCBI
Search summary 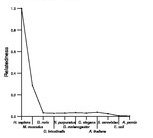
Figure data | ||
Related human proteins:Protein Relative score Description Self-match 1.000 hypothetical protein LOC729627 LOC389151 0.865 hypothetical protein LOC389151 FLJ46210 0.786 hypothetical protein LOC389152 PELP1 0.039 proline, glutamic acid and leucine rich protein 1 [... MLL2 0.033 myeloid/lymphoid or mixed-lineage leukemia 2 ZFHX4 0.031 zinc finger homeodomain 4 SNRPB 0.031 small nuclear ribonucleoprotein polypeptide B/B' iso... MYPOP 0.031 Myb protein P42POP NACA 0.031 nascent polypeptide-associated complex alpha subuni... NCOR2 0.029 nuclear receptor co-repressor 2 isoform 2 SYNJ1 0.029 synaptojanin 1 isoform c SYNJ1 0.029 synaptojanin 1 isoform a SYNJ1 0.029 synaptojanin 1 isoform b MAP1A 0.029 microtubule-associated protein 1A NCOR2 0.027 nuclear receptor co-repressor 2 isoform 1 LOC100131608 0.027 PREDICTED: hypothetical protein LOC100133251 0.027 PREDICTED: hypothetical protein LOC100131608 0.027 PREDICTED: hypothetical protein FMNL1 0.027 formin-like 1 SF3A2 0.025 splicing factor 3a, subunit 2 PER1 0.025 period 1 SYNJ1 0.025 synaptojanin 1 isoform d MLL4 0.023 myeloid/lymphoid or mixed-lineage leukemia 4 RAI1 0.023 retinoic acid induced 1 RERE 0.023 atrophin-1 like protein isoform b RERE 0.023 atrophin-1 like protein isoform a RERE 0.023 atrophin-1 like protein isoform a RGS3 0.023 regulator of G-protein signalling 3 isoform 6 [Homo... RGS3 0.023 regulator of G-protein signalling 3 isoform 2 RGS3 0.023 regulator of G-protein signalling 3 isoform 1Human BLASTP results (used to prepare the table) | |||
Gene descriptions are from NCBI RefSeq. Search results were obtained with NCBI BLAST and RefSeq entries. When identical proteins are present, the self-match may not be listed first in BLASTP output. In such cases, the table above has been reordered to place it first.
See About the Figures for the scoring system used in the figure above right. The same scoring system was used in the table of BLASTP results.
Guide to the Human Genome
Copyright © 2010 by Stewart Scherer. All rights reserved.
