
| Name: RAI1 | Sequence: fasta or formatted (1906aa) | NCBI GI: 40807477 | |
|
Description: retinoic acid induced 1
|
Referenced in: Additional Genes in Development
| ||
|
Composition:
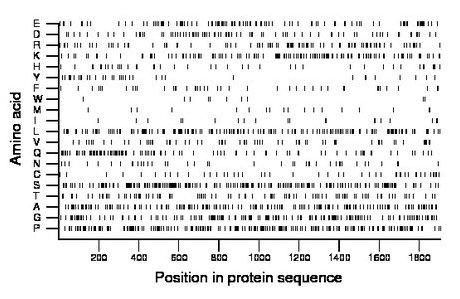
Amino acid Percentage Count Longest homopolymer A alanine 9.0 171 4 C cysteine 2.7 52 2 D aspartate 4.2 80 2 E glutamate 5.9 113 3 F phenylalanine 2.3 44 1 G glycine 8.6 163 4 H histidine 2.2 42 2 I isoleucine 1.0 20 1 K lysine 7.1 136 3 L leucine 8.7 165 3 M methionine 1.0 20 2 N asparagine 2.2 42 1 P proline 11.1 212 4 Q glutamine 6.0 114 14 R arginine 5.4 102 3 S serine 11.4 217 8 T threonine 5.2 99 3 V valine 3.4 65 2 W tryptophan 0.5 10 1 Y tyrosine 2.0 39 2 |
Comparative genomics:
Search single species RefSeq proteins at NCBI
Search summary 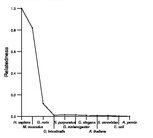
Figure data | ||
Related human proteins:Protein Relative score Description Self-match 1.000 retinoic acid induced 1 TCF20 0.058 transcription factor 20 isoform 2 TCF20 0.058 transcription factor 20 isoform 1 NACA 0.013 nascent polypeptide-associated complex alpha subuni... MLL2 0.012 myeloid/lymphoid or mixed-lineage leukemia 2 MLL 0.012 myeloid/lymphoid or mixed-lineage leukemia protein [... MLL3 0.012 myeloid/lymphoid or mixed-lineage leukemia 3 SRRM2 0.011 splicing coactivator subunit SRm300 MLL4 0.010 myeloid/lymphoid or mixed-lineage leukemia 4 ATN1 0.010 atrophin-1 ATN1 0.010 atrophin-1 SRRM1 0.010 serine/arginine repetitive matrix 1 MED15 0.009 mediator complex subunit 15 isoform b KIAA2018 0.009 hypothetical protein LOC205717 BMP2K 0.009 BMP-2 inducible kinase isoform a BMP2K 0.009 BMP-2 inducible kinase isoform b SHANK3 0.008 SH3 and multiple ankyrin repeat domains 3 NEFH 0.008 neurofilament, heavy polypeptide 200kDa MED12 0.008 mediator complex subunit 12 MED15 0.008 mediator complex subunit 15 isoform a MAPT 0.008 microtubule-associated protein tau isoform 1 EP400 0.008 E1A binding protein p400 PRB1 0.008 proline-rich protein BstNI subfamily 1 isoform 1 pre... MAML2 0.007 mastermind-like 2 NOLC1 0.007 nucleolar and coiled-body phosphoprotein 1 MAPT 0.007 microtubule-associated protein tau isoform 6 MN1 0.007 meningioma 1 ATXN1 0.007 ataxin 1 ATXN1 0.007 ataxin 1 LOC100130128 0.007 PREDICTED: hypothetical proteinHuman BLASTP results (used to prepare the table) | |||
Gene descriptions are from NCBI RefSeq. Search results were obtained with NCBI BLAST and RefSeq entries. When identical proteins are present, the self-match may not be listed first in BLASTP output. In such cases, the table above has been reordered to place it first.
See About the Figures for the scoring system used in the figure above right. The same scoring system was used in the table of BLASTP results.
Guide to the Human Genome
Copyright © 2010 by Stewart Scherer. All rights reserved.
