
| Name: CSAG2 | Sequence: fasta or formatted (127aa) | NCBI GI: 157502216 | |
|
Description: CSAG family, member 2 isoform 1
|
Referenced in:
| ||
Other entries for this name:
alt prot [110aa] CSAG family, member 2 isoform 2 | |||
|
Composition:
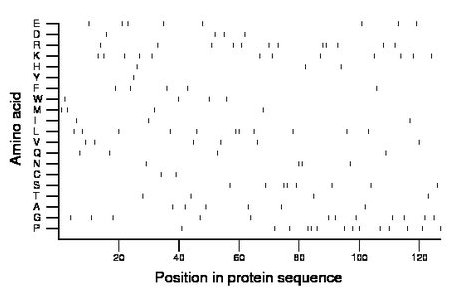
Amino acid Percentage Count Longest homopolymer A alanine 4.7 6 1 C cysteine 1.6 2 1 D aspartate 3.1 4 1 E glutamate 6.3 8 1 F phenylalanine 3.9 5 1 G glycine 9.4 12 1 H histidine 2.4 3 1 I isoleucine 2.4 3 1 K lysine 9.4 12 1 L leucine 8.7 11 2 M methionine 3.1 4 1 N asparagine 3.1 4 2 P proline 11.0 14 2 Q glutamine 3.1 4 1 R arginine 9.4 12 2 S serine 6.3 8 2 T threonine 3.1 4 1 V valine 4.7 6 1 W tryptophan 3.1 4 1 Y tyrosine 0.8 1 1 |
Comparative genomics:
Search single species RefSeq proteins at NCBI
Search summary 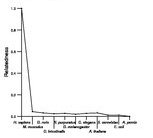
Figure data | ||
Related human proteins:Protein Relative score Description Self-match 1.000 CSAG family, member 2 isoform 1 CSAG3 1.000 CSAG family, member 3 isoform a CSAG2 0.810 CSAG family, member 2 isoform 2 CSAG3 0.810 CSAG family, member 3 isoform b LOC100130935 0.782 PREDICTED: similar to CSAG family, member 2 LOC100130935 0.782 PREDICTED: similar to CSAG family, member 2 LOC100130935 0.770 PREDICTED: similar to CSAG family, member 2 CSAG1 0.419 chondrosarcoma associated gene 1 CSAG1 0.419 chondrosarcoma associated gene 1 C15orf39 0.036 hypothetical protein LOC56905 BLNK 0.028 B-cell linker isoform 1 COL9A2 0.028 alpha 2 type IX collagen COL3A1 0.024 collagen type III alpha 1 preproprotein ZNF324 0.024 zinc finger protein 324 EDA 0.020 ectodysplasin A isoform EDA-A2 EDA 0.020 ectodysplasin A isoform EDA-A1 CLDN19 0.020 claudin 19 isoform a NIPBL 0.020 delangin isoform B NIPBL 0.020 delangin isoform A AEBP1 0.020 adipocyte enhancer binding protein 1 precursor [Homo... KLRG2 0.020 killer cell lectin-like receptor subfamily G, member... SMG7 0.020 SMG-7 homolog isoform 1 SMG7 0.020 SMG-7 homolog isoform 4 SMG7 0.020 SMG-7 homolog isoform 2 MIXL1 0.020 Mix-like homeobox protein 1 COL18A1 0.016 alpha 1 type XVIII collagen isoform 3 precursor [Ho... COL18A1 0.016 alpha 1 type XVIII collagen isoform 2 precursor [Ho... COL18A1 0.016 alpha 1 type XVIII collagen isoform 1 precursor [Ho... COL6A2 0.016 alpha 2 type VI collagen isoform 2C2a' precursor [H... COL6A2 0.016 alpha 2 type VI collagen isoform 2C2a precursor [Ho...Human BLASTP results (used to prepare the table) | |||
Gene descriptions are from NCBI RefSeq. Search results were obtained with NCBI BLAST and RefSeq entries. When identical proteins are present, the self-match may not be listed first in BLASTP output. In such cases, the table above has been reordered to place it first.
See About the Figures for the scoring system used in the figure above right. The same scoring system was used in the table of BLASTP results.
Guide to the Human Genome
Copyright © 2010 by Stewart Scherer. All rights reserved.
