
| Name: INO80D | Sequence: fasta or formatted (1027aa) | NCBI GI: 148539591 | |
|
Description: INO80 complex subunit D
|
Referenced in: Nonhistone Chromosomal Proteins
| ||
|
Composition:
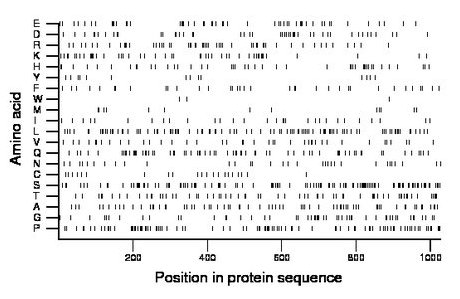
Amino acid Percentage Count Longest homopolymer A alanine 6.8 70 2 C cysteine 2.0 21 1 D aspartate 5.1 52 4 E glutamate 5.6 57 2 F phenylalanine 3.5 36 2 G glycine 5.0 51 2 H histidine 4.3 44 1 I isoleucine 2.9 30 1 K lysine 5.3 54 3 L leucine 9.8 101 2 M methionine 1.4 14 1 N asparagine 3.2 33 2 P proline 9.3 96 3 Q glutamine 6.9 71 3 R arginine 5.6 57 3 S serine 11.0 113 4 T threonine 6.6 68 2 V valine 4.0 41 2 W tryptophan 0.3 3 1 Y tyrosine 1.5 15 1 |
Comparative genomics:
Search single species RefSeq proteins at NCBI
Search summary 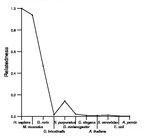
Figure data | ||
Related human proteins:Protein Relative score Description Self-match 1.000 INO80 complex subunit D C12orf41 0.023 hypothetical protein LOC54934 C13orf23 0.010 hypothetical protein LOC80209 isoform 2 C13orf23 0.010 hypothetical protein LOC80209 isoform 1 MUC6 0.010 mucin 6, gastric NUP214 0.010 nucleoporin 214kDa MUC17 0.010 mucin 17 POU6F2 0.010 POU domain, class 6, transcription factor 2 BRD4 0.009 bromodomain-containing protein 4 isoform long TOX 0.009 thymus high mobility group box protein TOX LOC100288540 0.008 PREDICTED: hypothetical protein XP_002342775 LOC100133761 0.008 PREDICTED: similar to Mucin-6, partial MUC4 0.008 mucin 4 isoform a LOC100133756 0.007 PREDICTED: hypothetical protein, partial CBLL1 0.007 Cas-Br-M (murine) ecotropic retroviral transforming... LOC100133915 0.007 PREDICTED: hypothetical protein MLL2 0.007 myeloid/lymphoid or mixed-lineage leukemia 2 MNT 0.007 MAX binding protein CEP164 0.007 centrosomal protein 164kDa MED15 0.007 mediator complex subunit 15 isoform a MED15 0.007 mediator complex subunit 15 isoform b NCOA6 0.007 nuclear receptor coactivator 6 ATXN2L 0.007 ataxin 2 related protein isoform B ATXN2L 0.007 ataxin 2 related protein isoform E ATXN2L 0.007 ataxin 2 related protein isoform C ATXN2L 0.007 ataxin 2 related protein isoform A ATXN2L 0.007 ataxin 2 related protein isoform D MLL5 0.007 myeloid/lymphoid or mixed-lineage leukemia 5 MLL5 0.007 myeloid/lymphoid or mixed-lineage leukemia 5 EP400 0.007 E1A binding protein p400Human BLASTP results (used to prepare the table) | |||
Gene descriptions are from NCBI RefSeq. Search results were obtained with NCBI BLAST and RefSeq entries. When identical proteins are present, the self-match may not be listed first in BLASTP output. In such cases, the table above has been reordered to place it first.
See About the Figures for the scoring system used in the figure above right. The same scoring system was used in the table of BLASTP results.
Guide to the Human Genome
Copyright © 2010 by Stewart Scherer. All rights reserved.
