
| Name: DSCR6 | Sequence: fasta or formatted (190aa) | NCBI GI: 9506557 | |
|
Description: Down syndrome critical region protein 6
| Not currently referenced in the text | ||
|
Composition:
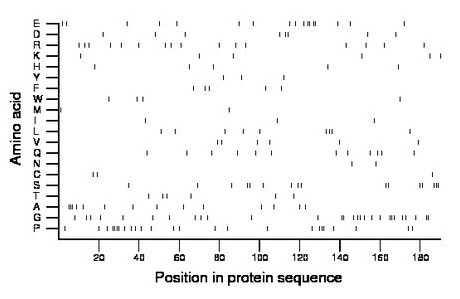
Amino acid Percentage Count Longest homopolymer A alanine 7.4 14 3 C cysteine 1.6 3 1 D aspartate 4.2 8 2 E glutamate 8.9 17 2 F phenylalanine 2.6 5 1 G glycine 14.7 28 3 H histidine 2.6 5 1 I isoleucine 1.6 3 1 K lysine 3.2 6 1 L leucine 4.7 9 2 M methionine 1.1 2 1 N asparagine 1.1 2 1 P proline 13.2 25 4 Q glutamine 6.3 12 1 R arginine 8.4 16 1 S serine 8.4 16 3 T threonine 3.2 6 1 V valine 3.2 6 1 W tryptophan 2.1 4 1 Y tyrosine 1.6 3 1 |
Comparative genomics:
Search single species RefSeq proteins at NCBI
Search summary 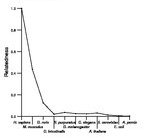
Figure data | ||
Related human proteins:Protein Relative score Description Self-match 1.000 Down syndrome critical region protein 6 RIPPLY1 0.109 ripply1 homolog RIPPLY2 0.104 ripply2 protein PLCH2 0.034 phospholipase C, eta 2 EWSR1 0.034 Ewing sarcoma breakpoint region 1 isoform 3 EWSR1 0.034 Ewing sarcoma breakpoint region 1 isoform 1 MINK1 0.034 misshapen/NIK-related kinase isoform 2 MINK1 0.034 misshapen/NIK-related kinase isoform 3 MINK1 0.034 misshapen/NIK-related kinase isoform 1 LOC100287420 0.031 PREDICTED: hypothetical protein XP_002343588 ASXL1 0.031 additional sex combs like 1 UTF1 0.029 undifferentiated embryonic cell transcription factor... LOC100294404 0.029 PREDICTED: hypothetical protein isoform 2 LOC100294404 0.029 PREDICTED: hypothetical protein isoform 1 ZNF696 0.029 zinc finger protein 696 ARHGEF17 0.026 Rho guanine nucleotide exchange factor (GEF) 17 [Hom... ZNF469 0.026 zinc finger protein 469 PRB2 0.026 proline-rich protein BstNI subfamily 2 C21orf66 0.026 GC-rich sequence DNA-binding factor candidate isofor... C21orf66 0.026 GC-rich sequence DNA-binding factor candidate isofor... HNRNPAB 0.026 heterogeneous nuclear ribonucleoprotein A/B isoform ... EPAS1 0.021 endothelial PAS domain protein 1 PRH1 0.021 proline-rich protein HaeIII subfamily 1 WDR33 0.021 WD repeat domain 33 isoform 1 LOC100128979 0.021 PREDICTED: hypothetical protein LOC100128979 0.021 PREDICTED: hypothetical protein LRRC38 0.021 PREDICTED: leucine rich repeat containing 38 LOC100128979 0.021 PREDICTED: hypothetical protein LRRC38 0.021 PREDICTED: leucine rich repeat containing 38 SETD1A 0.021 SET domain containing 1AHuman BLASTP results (used to prepare the table) | |||
Gene descriptions are from NCBI RefSeq. Search results were obtained with NCBI BLAST and RefSeq entries. When identical proteins are present, the self-match may not be listed first in BLASTP output. In such cases, the table above has been reordered to place it first.
See About the Figures for the scoring system used in the figure above right. The same scoring system was used in the table of BLASTP results.
Guide to the Human Genome
Copyright © 2010 by Stewart Scherer. All rights reserved.
