
| Name: DONSON | Sequence: fasta or formatted (566aa) | NCBI GI: 8922149 | |
|
Description: downstream neighbor of SON
| Not currently referenced in the text | ||
|
Composition:
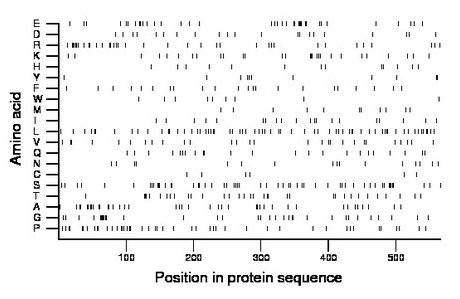
Amino acid Percentage Count Longest homopolymer A alanine 7.6 43 3 C cysteine 1.1 6 1 D aspartate 3.7 21 1 E glutamate 6.7 38 3 F phenylalanine 3.9 22 1 G glycine 6.0 34 3 H histidine 2.3 13 1 I isoleucine 3.5 20 1 K lysine 5.1 29 2 L leucine 11.8 67 2 M methionine 2.1 12 1 N asparagine 2.8 16 1 P proline 8.1 46 2 Q glutamine 4.1 23 2 R arginine 6.4 36 2 S serine 9.7 55 2 T threonine 6.0 34 2 V valine 5.5 31 2 W tryptophan 1.6 9 1 Y tyrosine 1.9 11 1 |
Comparative genomics:
Search single species RefSeq proteins at NCBI
Search summary 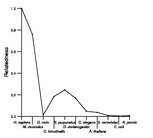
Figure data | ||
Related human proteins:Protein Relative score Description Self-match 1.000 downstream neighbor of SON LOC100131102 0.018 PREDICTED: hypothetical protein LOC100131102 0.018 PREDICTED: hypothetical protein LOC100131102 0.018 PREDICTED: hypothetical protein SFRS1 0.015 splicing factor, arginine/serine-rich 1 isoform 2 [... LOC100289126 0.014 PREDICTED: hypothetical protein XP_002343381 LOC100132234 0.014 PREDICTED: hypothetical protein LOC100132234 LOC284988 0.014 PREDICTED: hypothetical protein LOC100132234 0.014 PREDICTED: hypothetical protein LOC100132234 LOC100132234 0.014 PREDICTED: hypothetical protein LOC100132234 YBX2 0.014 Y box binding protein 2 LOC389813 0.014 similar to CG15216-PA C10orf47 0.011 hypothetical protein LOC254427 LOC100292048 0.011 PREDICTED: hypothetical protein XP_002344877 SFRS1 0.011 splicing factor, arginine/serine-rich 1 isoform 1 [Ho... XYLT1 0.011 xylosyltransferase I LOC100133885 0.011 PREDICTED: hypothetical protein FLJ37078 0.011 hypothetical protein LOC222183 SALL3 0.010 sal-like 3 LOC730456 0.010 PREDICTED: hypothetical protein DACT3 0.010 thymus expressed gene 3-like LOC100131455 0.009 PREDICTED: hypothetical protein LOC100131455 0.009 PREDICTED: hypothetical protein LOC100131455 0.009 PREDICTED: hypothetical protein MAP1S 0.009 BPY2 interacting protein 1 HMX2 0.009 H6 family homeobox 2 LOC100288573 0.009 PREDICTED: hypothetical protein XP_002343799 MAGI2 0.009 membrane associated guanylate kinase, WW and PDZ dom... MNX1 0.009 homeo box HB9 HNRNPUL2 0.009 heterogeneous nuclear ribonucleoprotein U-like 2 [H...Human BLASTP results (used to prepare the table) | |||
Gene descriptions are from NCBI RefSeq. Search results were obtained with NCBI BLAST and RefSeq entries. When identical proteins are present, the self-match may not be listed first in BLASTP output. In such cases, the table above has been reordered to place it first.
See About the Figures for the scoring system used in the figure above right. The same scoring system was used in the table of BLASTP results.
Guide to the Human Genome
Copyright © 2010 by Stewart Scherer. All rights reserved.
