
| Name: MICAL2 | Sequence: fasta or formatted (1124aa) | NCBI GI: 7662284 | |
|
Description: microtubule associated monoxygenase, calponin and LIM domain containing 2
|
Referenced in:
| ||
|
Composition:
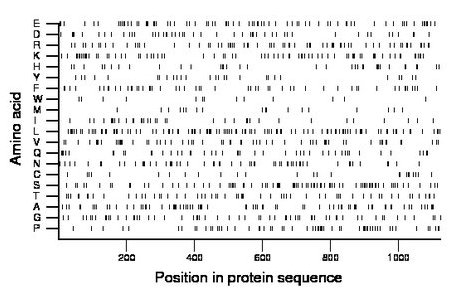
Amino acid Percentage Count Longest homopolymer A alanine 7.1 80 3 C cysteine 2.3 26 2 D aspartate 4.3 48 2 E glutamate 7.0 79 3 F phenylalanine 4.9 55 2 G glycine 5.9 66 3 H histidine 3.1 35 1 I isoleucine 3.3 37 2 K lysine 6.7 75 2 L leucine 9.9 111 2 M methionine 1.7 19 1 N asparagine 5.1 57 2 P proline 5.8 65 2 Q glutamine 4.3 48 3 R arginine 6.4 72 3 S serine 7.9 89 3 T threonine 5.3 60 2 V valine 5.4 61 4 W tryptophan 1.2 13 1 Y tyrosine 2.5 28 2 |
Comparative genomics:
Search single species RefSeq proteins at NCBI
Search summary 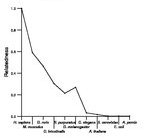
Figure data | ||
Related human proteins:Protein Relative score Description Self-match 1.000 microtubule associated monoxygenase, calponin and LIM... MICAL3 0.430 microtubule associated monoxygenase, calponin and L... MICAL3 0.429 microtubule associated monoxygenase, calponin and L... MICAL3 0.429 microtubule associated monoxygenase, calponin and L... MICAL1 0.266 microtubule associated monoxygenase, calponin and L... MICAL1 0.145 microtubule associated monoxygenase, calponin and L... MICALL2 0.042 MICAL-like 2 isoform 1 MICALL1 0.041 molecule interacting with Rab13 ACTN3 0.035 actinin, alpha 3 SPTB 0.034 spectrin beta isoform a SPTB 0.034 spectrin beta isoform b ACTN2 0.034 actinin, alpha 2 ACTN1 0.034 actinin, alpha 1 isoform c ACTN1 0.034 actinin, alpha 1 isoform a ACTN1 0.034 actinin, alpha 1 isoform b ACTN4 0.033 actinin, alpha 4 SPTBN2 0.032 spectrin, beta, non-erythrocytic 2 EHBP1 0.030 EH domain binding protein 1 isoform 3 EHBP1 0.030 EH domain binding protein 1 isoform 3 EHBP1 0.030 EH domain binding protein 1 isoform 2 EHBP1 0.030 EH domain binding protein 1 isoform 1 SPTBN1 0.030 spectrin, beta, non-erythrocytic 1 isoform 2 SPTBN1 0.030 spectrin, beta, non-erythrocytic 1 isoform 1 SPTBN4 0.029 spectrin, beta, non-erythrocytic 4 isoform sigma1 [... SPTBN5 0.029 spectrin, beta, non-erythrocytic 5 CYTSA 0.028 cytospin A CYTSA 0.028 cytospin A CYTSB 0.027 spectrin domain with coiled-coils 1 NSP5a3b CYTSB 0.027 spectrin domain with coiled-coils 1 NSP5b3b EHBP1L1 0.026 tangerinHuman BLASTP results (used to prepare the table) | |||
Gene descriptions are from NCBI RefSeq. Search results were obtained with NCBI BLAST and RefSeq entries. When identical proteins are present, the self-match may not be listed first in BLASTP output. In such cases, the table above has been reordered to place it first.
See About the Figures for the scoring system used in the figure above right. The same scoring system was used in the table of BLASTP results.
Guide to the Human Genome
Copyright © 2010 by Stewart Scherer. All rights reserved.
