
| Name: LIMD1 | Sequence: fasta or formatted (676aa) | NCBI GI: 7657307 | |
|
Description: LIM domains containing 1
|
Referenced in:
| ||
|
Composition:
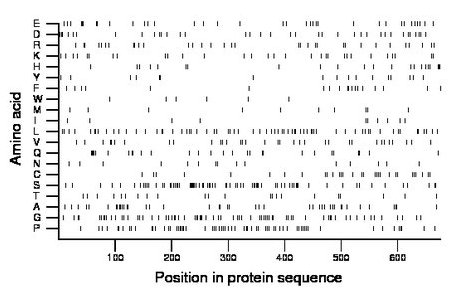
Amino acid Percentage Count Longest homopolymer A alanine 6.4 43 2 C cysteine 4.4 30 1 D aspartate 5.3 36 2 E glutamate 5.3 36 2 F phenylalanine 2.8 19 1 G glycine 10.8 73 3 H histidine 3.3 22 2 I isoleucine 1.5 10 1 K lysine 4.4 30 1 L leucine 9.8 66 2 M methionine 1.6 11 1 N asparagine 2.4 16 2 P proline 9.8 66 2 Q glutamine 4.4 30 6 R arginine 4.9 33 2 S serine 10.9 74 3 T threonine 3.4 23 2 V valine 5.2 35 2 W tryptophan 0.9 6 1 Y tyrosine 2.5 17 2 |
Comparative genomics:
Search single species RefSeq proteins at NCBI
Search summary 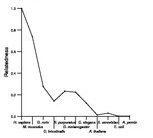
Figure data | ||
Related human proteins:Protein Relative score Description Self-match 1.000 LIM domains containing 1 WTIP 0.257 Wilms tumor 1 interacting protein JUB 0.220 ajuba isoform 1 LPP 0.155 LIM domain containing preferred translocation partner... TRIP6 0.142 thyroid receptor-interacting protein 6 ZYX 0.135 zyxin ZYX 0.135 zyxin JUB 0.122 ajuba isoform 2 FBLIM1 0.114 filamin-binding LIM protein-1 isoform a FBLIM1 0.108 filamin-binding LIM protein-1 isoform c FBLIM1 0.066 filamin-binding LIM protein-1 isoform b PXN 0.059 paxillin isoform 2 PXN 0.057 paxillin isoform 3 PXN 0.054 paxillin isoform 1 LIMS1 0.052 LIM and senescent cell antigen-like domains 1 LDB3 0.051 LIM domain binding 3 isoform 1 TGFB1I1 0.051 transforming growth factor beta 1 induced transcrip... TGFB1I1 0.051 transforming growth factor beta 1 induced transcript... LPXN 0.051 leupaxin isoform 1 LPXN 0.051 leupaxin isoform 2 LDB3 0.050 LIM domain binding 3 isoform 2 LIMS2 0.048 LIM and senescent cell antigen-like domains 2 isofo... LIMS2 0.048 LIM and senescent cell antigen-like domains 2 isofo... LIMS2 0.048 LIM and senescent cell antigen-like domains 2 isofo... LIMS2 0.048 LIM and senescent cell antigen-like domains 2 isofor... LOC100288695 0.046 PREDICTED: hypothetical protein XP_002342298 FHL1 0.043 four and a half LIM domains 1 isoform 2 FHL1 0.043 four and a half LIM domains 1 isoform 2 FHL1 0.043 four and a half LIM domains 1 isoform 3 FHL1 0.043 four and a half LIM domains 1 isoform 5Human BLASTP results (used to prepare the table) | |||
Gene descriptions are from NCBI RefSeq. Search results were obtained with NCBI BLAST and RefSeq entries. When identical proteins are present, the self-match may not be listed first in BLASTP output. In such cases, the table above has been reordered to place it first.
See About the Figures for the scoring system used in the figure above right. The same scoring system was used in the table of BLASTP results.
Guide to the Human Genome
Copyright © 2010 by Stewart Scherer. All rights reserved.
