
| Name: TGFB1I1 | Sequence: fasta or formatted (461aa) | NCBI GI: 109638745 | |
|
Description: transforming growth factor beta 1 induced transcript 1 isoform 1
|
Referenced in: LIM Domain Proteins
| ||
Other entries for this name:
alt prot [444aa] transforming growth factor beta 1 induced transcript 1 isoform 2 | |||
|
Composition:
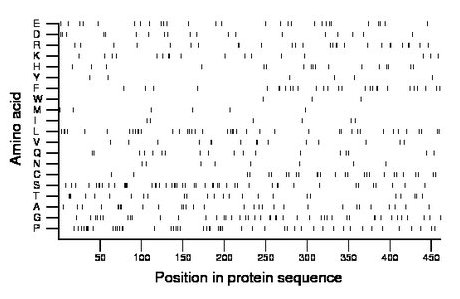
Amino acid Percentage Count Longest homopolymer A alanine 6.5 30 2 C cysteine 5.9 27 2 D aspartate 4.1 19 1 E glutamate 6.1 28 1 F phenylalanine 6.1 28 2 G glycine 9.5 44 2 H histidine 3.7 17 1 I isoleucine 1.3 6 1 K lysine 3.7 17 2 L leucine 8.9 41 2 M methionine 1.3 6 1 N asparagine 1.7 8 1 P proline 10.4 48 3 Q glutamine 3.9 18 1 R arginine 5.9 27 2 S serine 10.4 48 4 T threonine 5.4 25 3 V valine 3.3 15 2 W tryptophan 0.7 3 1 Y tyrosine 1.3 6 1 |
Comparative genomics:
Search single species RefSeq proteins at NCBI
Search summary 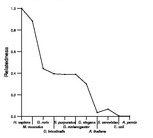
Figure data | ||
Related human proteins:Protein Relative score Description Self-match 1.000 transforming growth factor beta 1 induced transcrip... TGFB1I1 0.967 transforming growth factor beta 1 induced transcript... PXN 0.433 paxillin isoform 2 PXN 0.432 paxillin isoform 1 PXN 0.410 paxillin isoform 3 LPXN 0.366 leupaxin isoform 2 LPXN 0.363 leupaxin isoform 1 LDB3 0.153 LIM domain binding 3 isoform 2 LDB3 0.153 LIM domain binding 3 isoform 1 PDLIM5 0.150 PDZ and LIM domain 5 isoform b PDLIM5 0.150 PDZ and LIM domain 5 isoform a PDLIM7 0.148 PDZ and LIM domain 7 isoform 1 PDLIM7 0.146 PDZ and LIM domain 7 isoform 2 LIMS2 0.116 LIM and senescent cell antigen-like domains 2 isofo... LIMS2 0.116 LIM and senescent cell antigen-like domains 2 isofo... LIMS2 0.116 LIM and senescent cell antigen-like domains 2 isofo... LIMS2 0.116 LIM and senescent cell antigen-like domains 2 isofor... LIMS1 0.114 LIM and senescent cell antigen-like domains 1 ZYX 0.101 zyxin ZYX 0.101 zyxin FBLIM1 0.100 filamin-binding LIM protein-1 isoform a FHL3 0.099 four and a half LIM domains 3 ABLIM3 0.094 actin binding LIM protein family, member 3 ABLIM1 0.093 actin-binding LIM protein 1 isoform c ABLIM1 0.093 actin-binding LIM protein 1 isoform b ABLIM1 0.093 actin-binding LIM protein 1 isoform a FBLIM1 0.091 filamin-binding LIM protein-1 isoform c FHL5 0.091 activator of cAMP-responsive element modulator (CREM... FHL2 0.091 four and a half LIM domains 2 FHL2 0.091 four and a half LIM domains 2Human BLASTP results (used to prepare the table) | |||
Gene descriptions are from NCBI RefSeq. Search results were obtained with NCBI BLAST and RefSeq entries. When identical proteins are present, the self-match may not be listed first in BLASTP output. In such cases, the table above has been reordered to place it first.
See About the Figures for the scoring system used in the figure above right. The same scoring system was used in the table of BLASTP results.
Guide to the Human Genome
Copyright © 2010 by Stewart Scherer. All rights reserved.
