
| Name: TFCP2L1 | Sequence: fasta or formatted (479aa) | NCBI GI: 7657299 | |
|
Description: LBP-9
|
Referenced in: Additional Genes in Development
| ||
|
Composition:

Amino acid Percentage Count Longest homopolymer A alanine 5.4 26 2 C cysteine 1.9 9 1 D aspartate 4.8 23 2 E glutamate 7.1 34 2 F phenylalanine 4.0 19 1 G glycine 5.4 26 2 H histidine 3.8 18 1 I isoleucine 5.6 27 2 K lysine 5.2 25 1 L leucine 9.4 45 2 M methionine 1.0 5 1 N asparagine 4.6 22 1 P proline 6.3 30 2 Q glutamine 6.9 33 2 R arginine 5.8 28 2 S serine 7.7 37 1 T threonine 4.6 22 2 V valine 5.6 27 3 W tryptophan 1.3 6 1 Y tyrosine 3.5 17 1 |
Comparative genomics:
Search single species RefSeq proteins at NCBI
Search summary 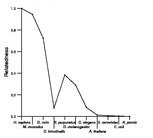
Figure data | ||
Related human proteins:Protein Relative score Description Self-match 1.000 LBP-9 TFCP2 0.729 transcription factor CP2 UBP1 0.649 upstream binding protein 1 (LBP-1a) isoform b [Homo... UBP1 0.630 upstream binding protein 1 (LBP-1a) isoform a [Homo... UBP1 0.630 upstream binding protein 1 (LBP-1a) isoform a [Homo... GRHL1 0.086 grainyhead-like 1 GRHL3 0.081 sister-of-mammalian grainyhead protein isoform 2 [Ho... GRHL3 0.081 sister-of-mammalian grainyhead protein isoform 3 [Ho... GRHL3 0.081 sister-of-mammalian grainyhead protein isoform 1 [Ho... GRHL2 0.078 transcription factor CP2-like 3 TNRC6B 0.010 trinucleotide repeat containing 6B isoform 3 TNRC6B 0.008 trinucleotide repeat containing 6B isoform 2 TNRC6B 0.008 trinucleotide repeat containing 6B isoform 1 SFRS2IP 0.008 splicing factor, arginine/serine-rich 2, interactin... EVC2 0.007 limbin ARID3A 0.007 AT rich interactive domain 3A (BRIGHT- like) protein ... SON 0.007 SON DNA-binding protein isoform F SON 0.007 SON DNA-binding protein isoform B BRD3 0.007 bromodomain containing protein 3 LOC100129826 0.006 PREDICTED: hypothetical protein LOC100129826 TJP1 0.005 tight junction protein 1 isoform b TJP1 0.005 tight junction protein 1 isoform a CCDC66 0.005 coiled-coil domain containing 66 isoform 1 CCDC66 0.005 coiled-coil domain containing 66 isoform 2 PPP1R12A 0.005 protein phosphatase 1, regulatory (inhibitor) subun... PPP1R12A 0.005 protein phosphatase 1, regulatory (inhibitor) subun... PPP1R12A 0.005 protein phosphatase 1, regulatory (inhibitor) subunit... IRS4 0.005 insulin receptor substrate 4 TCHH 0.005 trichohyalin PHF8 0.005 PHD finger protein 8Human BLASTP results (used to prepare the table) | |||
Gene descriptions are from NCBI RefSeq. Search results were obtained with NCBI BLAST and RefSeq entries. When identical proteins are present, the self-match may not be listed first in BLASTP output. In such cases, the table above has been reordered to place it first.
See About the Figures for the scoring system used in the figure above right. The same scoring system was used in the table of BLASTP results.
Guide to the Human Genome
Copyright © 2010 by Stewart Scherer. All rights reserved.
