
| Name: APOA5 | Sequence: fasta or formatted (366aa) | NCBI GI: 63079709 | |
|
Description: apolipoprotein AV
|
Referenced in:
| ||
|
Composition:
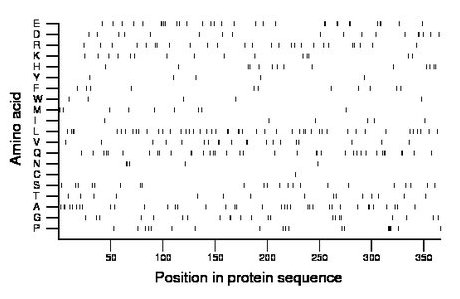
Amino acid Percentage Count Longest homopolymer A alanine 10.1 37 2 C cysteine 0.3 1 1 D aspartate 4.9 18 2 E glutamate 8.5 31 2 F phenylalanine 3.0 11 1 G glycine 6.0 22 2 H histidine 3.8 14 2 I isoleucine 1.6 6 1 K lysine 4.1 15 1 L leucine 13.1 48 2 M methionine 2.5 9 1 N asparagine 1.4 5 2 P proline 5.2 19 4 Q glutamine 10.1 37 3 R arginine 7.1 26 2 S serine 6.0 22 1 T threonine 4.1 15 1 V valine 5.5 20 2 W tryptophan 1.4 5 1 Y tyrosine 1.4 5 1 |
Comparative genomics:
Search single species RefSeq proteins at NCBI
Search summary 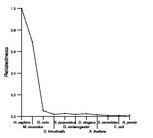
Figure data | ||
Related human proteins:Protein Relative score Description Self-match 1.000 apolipoprotein AV APOA4 0.142 apolipoprotein A-IV precursor APOA1 0.064 apolipoprotein A-I preproprotein APOE 0.037 apolipoprotein E precursor LOC653125 0.027 PREDICTED: similar to Golgin subfamily A member 8-l... LOC653125 0.027 PREDICTED: similar to Golgin subfamily A member 8-l... CGN 0.027 cingulin MYH14 0.026 myosin, heavy chain 14 isoform 1 MYH14 0.026 myosin, heavy chain 14 isoform 2 MYH14 0.026 myosin, heavy chain 14 isoform 3 LOC653073 0.026 PREDICTED: Golgin subfamily A member 8-like protein... LOC653073 0.026 PREDICTED: Golgin subfamily A member 8-like protein... LOC653073 0.026 PREDICTED: Golgin subfamily A member 8-like protein... LOC653720 0.026 PREDICTED: similar to Golgin subfamily A member 8-l... LOC653720 0.026 PREDICTED: similar to Golgin subfamily A member 8-l... GOLGA8B 0.026 golgi autoantigen, golgin subfamily a, 8B GOLGA8A 0.026 golgi autoantigen, golgin subfamily a, 8A LOC728498 0.024 PREDICTED: similar to Golgin subfamily A member 8-l... LOC728498 0.024 PREDICTED: similar to Golgin subfamily A member 8-l... CEP250 0.021 centrosomal protein 2 CLIP1 0.021 restin isoform b MYH3 0.021 myosin, heavy chain 3, skeletal muscle, embryonic [H... NUMA1 0.021 nuclear mitotic apparatus protein 1 ANKRD24 0.020 ankyrin repeat domain 24 PLEC1 0.020 plectin 1 isoform 11 PLEC1 0.020 plectin 1 isoform 10 PLEC1 0.020 plectin 1 isoform 8 PLEC1 0.020 plectin 1 isoform 7 PLEC1 0.020 plectin 1 isoform 6 PLEC1 0.020 plectin 1 isoform 3Human BLASTP results (used to prepare the table) | |||
Gene descriptions are from NCBI RefSeq. Search results were obtained with NCBI BLAST and RefSeq entries. When identical proteins are present, the self-match may not be listed first in BLASTP output. In such cases, the table above has been reordered to place it first.
See About the Figures for the scoring system used in the figure above right. The same scoring system was used in the table of BLASTP results.
Guide to the Human Genome
Copyright © 2010 by Stewart Scherer. All rights reserved.
