
| Name: CGN | Sequence: fasta or formatted (1203aa) | NCBI GI: 16262452 | |
|
Description: cingulin
|
Referenced in: Gap Junctions and Tight Junctions
| ||
|
Composition:
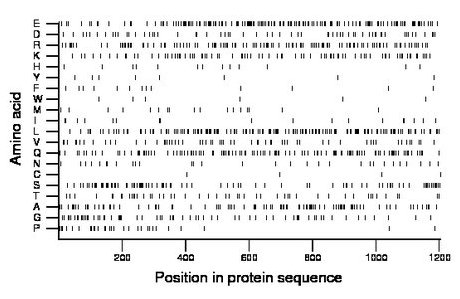
Amino acid Percentage Count Longest homopolymer A alanine 7.6 92 3 C cysteine 0.3 4 1 D aspartate 5.1 61 2 E glutamate 14.0 169 3 F phenylalanine 1.1 13 1 G glycine 5.5 66 2 H histidine 1.1 13 1 I isoleucine 1.5 18 1 K lysine 6.8 82 2 L leucine 12.2 147 2 M methionine 1.5 18 1 N asparagine 2.5 30 1 P proline 2.7 33 2 Q glutamine 9.9 119 2 R arginine 10.0 120 3 S serine 7.7 93 2 T threonine 4.2 50 2 V valine 5.1 61 2 W tryptophan 0.5 6 1 Y tyrosine 0.7 8 1 |
Comparative genomics:
Search single species RefSeq proteins at NCBI
Search summary 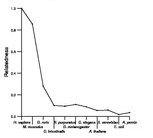
Figure data | ||
Related human proteins:Protein Relative score Description Self-match 1.000 cingulin CGNL1 0.195 cingulin-like 1 MYH10 0.113 myosin, heavy polypeptide 10, non-muscle MYH11 0.110 smooth muscle myosin heavy chain 11 isoform SM1A [Ho... MYH11 0.110 smooth muscle myosin heavy chain 11 isoform SM1B [Ho... MYH11 0.108 smooth muscle myosin heavy chain 11 isoform SM2B [Ho... MYH11 0.108 smooth muscle myosin heavy chain 11 isoform SM2A [Ho... MYH9 0.102 myosin, heavy polypeptide 9, non-muscle MYH14 0.096 myosin, heavy chain 14 isoform 1 MYH14 0.096 myosin, heavy chain 14 isoform 2 MYH14 0.096 myosin, heavy chain 14 isoform 3 MYH7 0.073 myosin, heavy chain 7, cardiac muscle, beta MYH2 0.071 myosin, heavy chain 2, skeletal muscle, adult [Homo... MYH2 0.071 myosin, heavy chain 2, skeletal muscle, adult [Homo... MYH6 0.071 myosin heavy chain 6 MYH8 0.071 myosin, heavy chain 8, skeletal muscle, perinatal [... MYH3 0.071 myosin, heavy chain 3, skeletal muscle, embryonic [H... TCHH 0.071 trichohyalin MYH7B 0.070 myosin, heavy polypeptide 7B, cardiac muscle, beta ... MYH1 0.070 myosin, heavy chain 1, skeletal muscle, adult [Homo... MYH4 0.068 myosin, heavy polypeptide 4, skeletal muscle MYH15 0.065 myosin, heavy polypeptide 15 CEP250 0.065 centrosomal protein 2 MYH13 0.064 myosin, heavy polypeptide 13, skeletal muscle [Homo... NUMA1 0.061 nuclear mitotic apparatus protein 1 PLEC1 0.061 plectin 1 isoform 11 PLEC1 0.061 plectin 1 isoform 10 PLEC1 0.061 plectin 1 isoform 8 PLEC1 0.061 plectin 1 isoform 7 PLEC1 0.061 plectin 1 isoform 6Human BLASTP results (used to prepare the table) | |||
Gene descriptions are from NCBI RefSeq. Search results were obtained with NCBI BLAST and RefSeq entries. When identical proteins are present, the self-match may not be listed first in BLASTP output. In such cases, the table above has been reordered to place it first.
See About the Figures for the scoring system used in the figure above right. The same scoring system was used in the table of BLASTP results.
Guide to the Human Genome
Copyright © 2010 by Stewart Scherer. All rights reserved.
