
| Name: NKRF | Sequence: fasta or formatted (690aa) | NCBI GI: 63003897 | |
|
Description: transcription factor NRF
|
Referenced in: NF-kappaB Pathway
| ||
|
Composition:
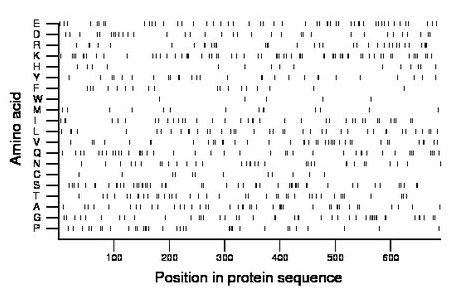
Amino acid Percentage Count Longest homopolymer A alanine 6.1 42 3 C cysteine 1.7 12 1 D aspartate 4.9 34 1 E glutamate 7.4 51 2 F phenylalanine 2.6 18 1 G glycine 6.5 45 3 H histidine 2.2 15 1 I isoleucine 5.5 38 2 K lysine 9.3 64 3 L leucine 6.2 43 2 M methionine 2.2 15 2 N asparagine 4.9 34 2 P proline 5.1 35 2 Q glutamine 5.9 41 2 R arginine 5.1 35 2 S serine 7.7 53 3 T threonine 5.9 41 2 V valine 5.9 41 2 W tryptophan 0.7 5 1 Y tyrosine 4.1 28 1 |
Comparative genomics:
Search single species RefSeq proteins at NCBI
Search summary 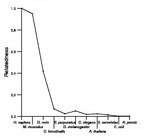
Figure data | ||
Related human proteins:Protein Relative score Description Self-match 1.000 transcription factor NRF CDKN2AIP 0.050 CDKN2A interacting protein GPATCH2 0.022 G patch domain containing 2 SFRS14 0.021 splicing factor, arginine/serine-rich 14 SFRS14 0.021 splicing factor, arginine/serine-rich 14 SF4 0.017 splicing factor 4 AGGF1 0.016 angiogenic factor VG5Q CHERP 0.015 calcium homeostasis endoplasmic reticulum protein [... RBM5 0.015 RNA binding motif protein 5 GPATCH8 0.015 G patch domain containing 8 CCDC75 0.014 coiled-coil domain containing 75 YTHDC2 0.013 YTH domain containing 2 RBM10 0.012 RNA binding motif protein 10 isoform 1 RBM10 0.012 RNA binding motif protein 10 isoform 2 SON 0.012 SON DNA-binding protein isoform F TFIP11 0.009 tuftelin interacting protein 11 TFIP11 0.009 tuftelin interacting protein 11 IGHMBP2 0.009 immunoglobulin mu binding protein 2 PINX1 0.008 PIN2-interacting protein 1 WDR60 0.007 WD repeat domain 60 EIF2AK2 0.006 eukaryotic translation initiation factor 2-alpha ki... EIF2AK2 0.006 eukaryotic translation initiation factor 2-alpha ki... EIF2AK2 0.006 eukaryotic translation initiation factor 2-alpha kina... C14orf106 0.006 chromosome 14 open reading frame 106 FTSJD2 0.006 FtsJ methyltransferase domain containing 2 BCL9 0.006 B-cell CLL/lymphoma 9 FNBP4 0.006 formin binding protein 4 LAMA4 0.005 laminin, alpha 4 isoform 2 precursor LAMA4 0.005 laminin, alpha 4 isoform 1 precursor LAMA4 0.005 laminin, alpha 4 isoform 2 precursorHuman BLASTP results (used to prepare the table) | |||
Gene descriptions are from NCBI RefSeq. Search results were obtained with NCBI BLAST and RefSeq entries. When identical proteins are present, the self-match may not be listed first in BLASTP output. In such cases, the table above has been reordered to place it first.
See About the Figures for the scoring system used in the figure above right. The same scoring system was used in the table of BLASTP results.
Guide to the Human Genome
Copyright © 2010 by Stewart Scherer. All rights reserved.
