
| Name: IRX1 | Sequence: fasta or formatted (480aa) | NCBI GI: 51479177 | |
|
Description: iroquois homeobox protein 1
|
Referenced in:
| ||
|
Composition:
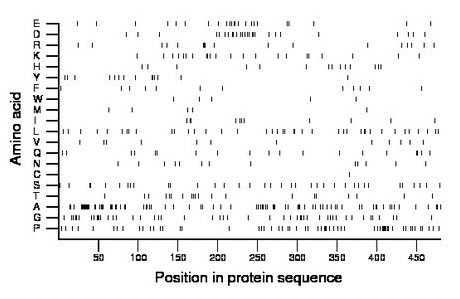
Amino acid Percentage Count Longest homopolymer A alanine 16.7 80 10 C cysteine 0.2 1 1 D aspartate 5.4 26 2 E glutamate 4.8 23 2 F phenylalanine 2.5 12 1 G glycine 10.0 48 3 H histidine 2.9 14 1 I isoleucine 2.3 11 2 K lysine 4.6 22 2 L leucine 8.3 40 2 M methionine 1.2 6 1 N asparagine 2.7 13 1 P proline 12.5 60 4 Q glutamine 4.0 19 2 R arginine 3.5 17 3 S serine 7.7 37 2 T threonine 4.2 20 1 V valine 2.5 12 1 W tryptophan 1.0 5 1 Y tyrosine 2.9 14 2 |
Comparative genomics:
Search single species RefSeq proteins at NCBI
Search summary 
Figure data | ||
Related human proteins:Protein Relative score Description Self-match 1.000 iroquois homeobox protein 1 IRX3 0.314 iroquois homeobox 3 IRX2 0.188 iroquois homeobox 2 IRX2 0.188 iroquois homeobox 2 IRX4 0.181 iroquois homeobox 4 IRX6 0.179 iroquois homeobox protein 6 IRX5 0.172 iroquois homeobox protein 5 MKX 0.055 mohawk homeobox MNX1 0.035 homeo box HB9 DMBX1 0.035 diencephalon/mesencephalon homeobox 1 isoform a [Hom... PKNOX1 0.034 PBX/knotted 1 homeobox 1 DMBX1 0.034 diencephalon/mesencephalon homeobox 1 isoform b [Hom... TGIF1 0.033 TG-interacting factor isoform a TGIF1 0.033 TG-interacting factor isoform c TGIF1 0.033 TG-interacting factor isoform d TGIF1 0.033 TG-interacting factor isoform d TGIF1 0.033 TG-interacting factor isoform d TGIF1 0.033 TG-interacting factor isoform d TGIF1 0.033 TG-interacting factor isoform c TGIF1 0.033 TG-interacting factor isoform b PKNOX2 0.033 PBX/knotted 1 homeobox 2 TGIF2LX 0.033 TGFB-induced factor homeobox 2-like, X-linked UNCX 0.032 UNC homeobox MEIS3 0.031 Meis1, myeloid ecotropic viral integration site 1 ho... TGIF2 0.031 TGFB-induced factor homeobox 2 NACA 0.030 nascent polypeptide-associated complex alpha subuni... SIX5 0.030 sine oculis homeobox homolog 5 HOXB7 0.030 homeobox B7 MEIS2 0.029 Meis homeobox 2 isoform h MEIS2 0.029 Meis homeobox 2 isoform gHuman BLASTP results (used to prepare the table) | |||
Gene descriptions are from NCBI RefSeq. Search results were obtained with NCBI BLAST and RefSeq entries. When identical proteins are present, the self-match may not be listed first in BLASTP output. In such cases, the table above has been reordered to place it first.
See About the Figures for the scoring system used in the figure above right. The same scoring system was used in the table of BLASTP results.
Guide to the Human Genome
Copyright © 2010 by Stewart Scherer. All rights reserved.
