
| Name: ATXN1 | Sequence: fasta or formatted (815aa) | NCBI GI: 189491748 | |
|
Description: ataxin 1
|
Referenced in:
| ||
Other entries for this name:
alt mRNA [815aa] ataxin 1 | |||
|
Composition:
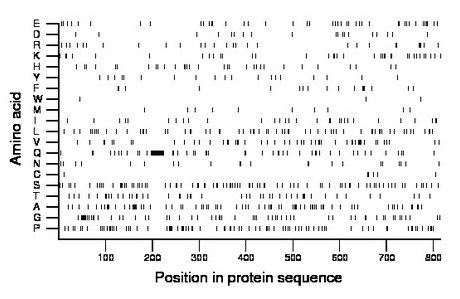
Amino acid Percentage Count Longest homopolymer A alanine 9.3 76 3 C cysteine 0.7 6 2 D aspartate 2.3 19 1 E glutamate 5.3 43 2 F phenylalanine 2.1 17 2 G glycine 7.4 60 3 H histidine 3.8 31 1 I isoleucine 3.7 30 2 K lysine 4.5 37 2 L leucine 7.7 63 2 M methionine 1.3 11 1 N asparagine 2.7 22 1 P proline 10.7 87 3 Q glutamine 9.0 73 14 R arginine 3.6 29 2 S serine 10.9 89 3 T threonine 5.9 48 2 V valine 6.4 52 3 W tryptophan 0.4 3 1 Y tyrosine 2.3 19 1 |
Comparative genomics:
Search single species RefSeq proteins at NCBI
Search summary 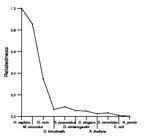
Figure data | ||
Related human proteins:Protein Relative score Description Self-match 1.000 ataxin 1 ATXN1 1.000 ataxin 1 ATXN1L 0.144 ataxin 1-like ATN1 0.030 atrophin-1 ATN1 0.030 atrophin-1 TBP 0.028 TATA box binding protein MED12 0.025 mediator complex subunit 12 EP400 0.025 E1A binding protein p400 PAXIP1 0.025 PAX interacting protein 1 NCOA3 0.024 nuclear receptor coactivator 3 isoform a NCOA3 0.024 nuclear receptor coactivator 3 isoform b FOXP2 0.024 forkhead box P2 isoform I FOXP2 0.023 forkhead box P2 isoform III FOXP2 0.023 forkhead box P2 isoform II MED15 0.023 mediator complex subunit 15 isoform b MAML2 0.023 mastermind-like 2 MN1 0.023 meningioma 1 MAML3 0.023 mastermind-like 3 BMP2K 0.022 BMP-2 inducible kinase isoform a BMP2K 0.022 BMP-2 inducible kinase isoform b FRMPD3 0.021 PREDICTED: FERM and PDZ domain containing 3 FRMPD3 0.021 PREDICTED: FERM and PDZ domain containing 3 FRMPD3 0.021 PREDICTED: FERM and PDZ domain containing 3 POU6F2 0.021 POU domain, class 6, transcription factor 2 MLL2 0.020 myeloid/lymphoid or mixed-lineage leukemia 2 THAP11 0.020 THAP domain containing 11 NCOA6 0.020 nuclear receptor coactivator 6 POU3F2 0.019 POU domain, class 3, transcription factor 2 NUMBL 0.019 numb homolog (Drosophila)-like MED15 0.019 mediator complex subunit 15 isoform aHuman BLASTP results (used to prepare the table) | |||
Gene descriptions are from NCBI RefSeq. Search results were obtained with NCBI BLAST and RefSeq entries. When identical proteins are present, the self-match may not be listed first in BLASTP output. In such cases, the table above has been reordered to place it first.
See About the Figures for the scoring system used in the figure above right. The same scoring system was used in the table of BLASTP results.
Guide to the Human Genome
Copyright © 2010 by Stewart Scherer. All rights reserved.
